Question
1. Assume 2018 values of ARPU = $7.43, DAU = 198 million, COGS/user = $5.42, SG&A = $2.941 billion, R&D = $2.5 billion, depreciation =
1. Assume 2018 values of ARPU = $7.43, DAU = 198 million, COGS/user = $5.42, SG&A = $2.941
billion, R&D = $2.5 billion, depreciation = $103 million, CAPEX = $441 million, and increased NWC
is $323 million. Ignore taxes.
a.
Find projected free cash flow in 2018.
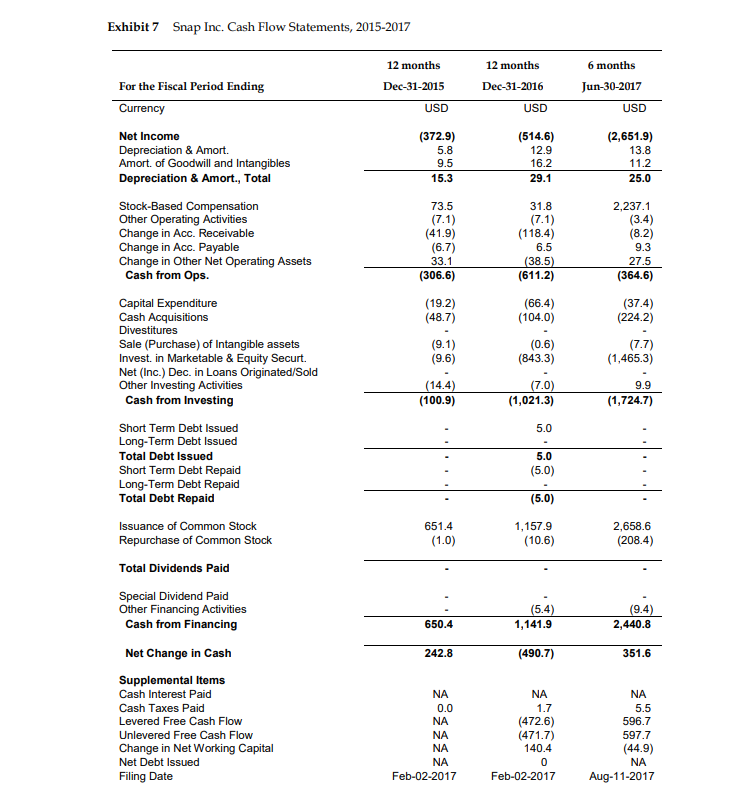
b.
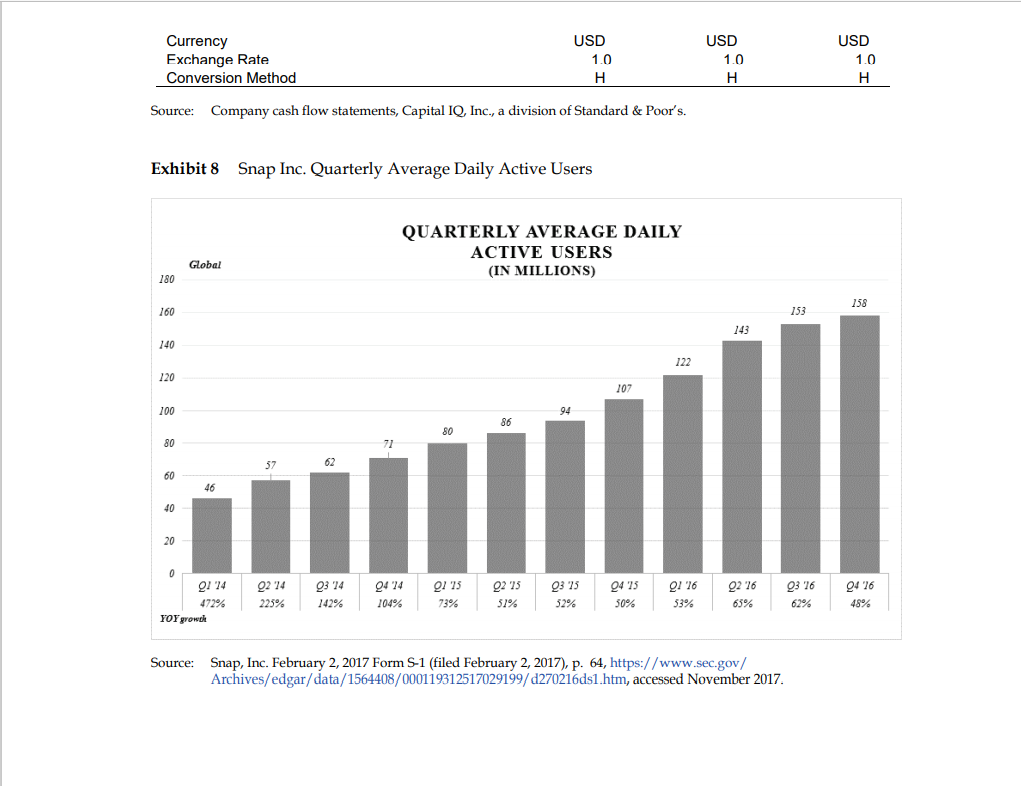
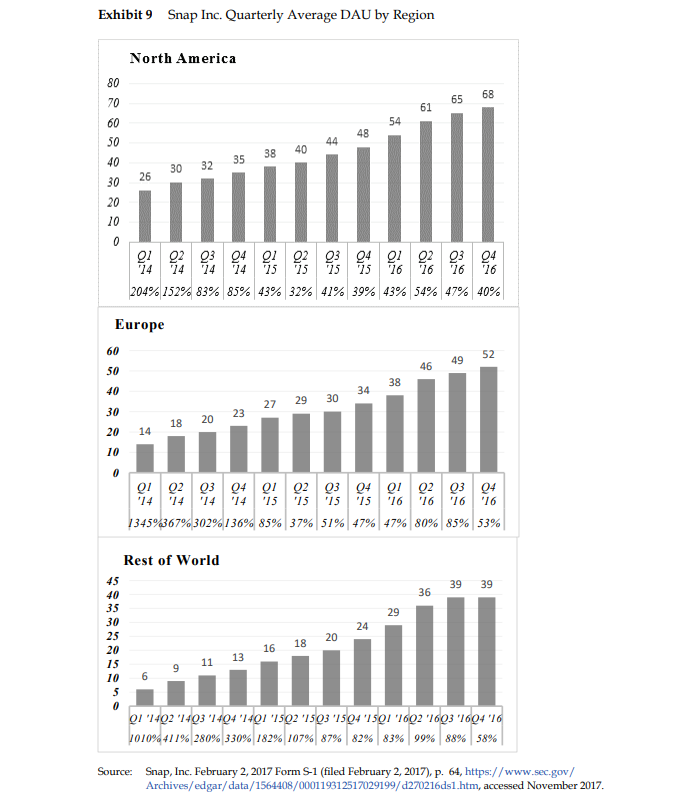
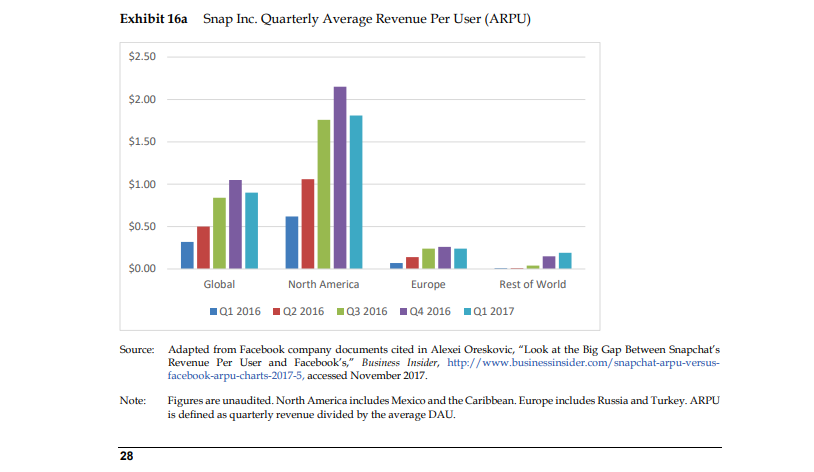
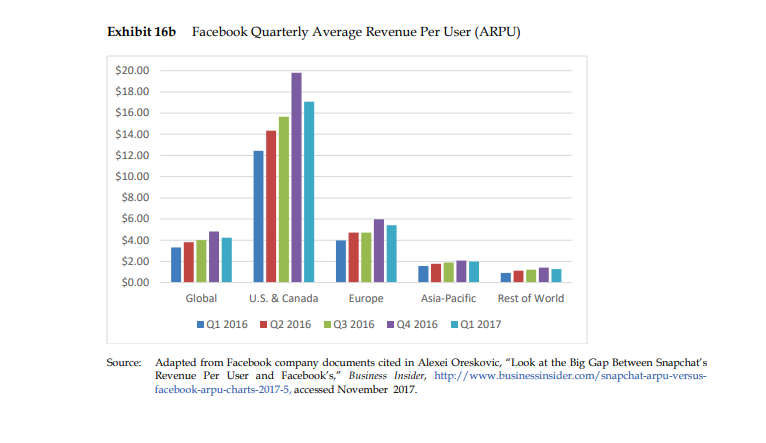
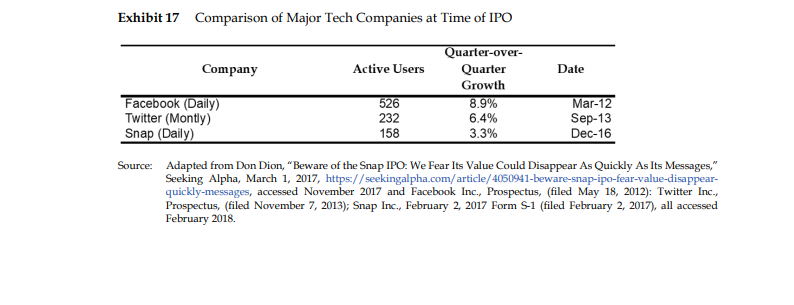
Estimate grow rates based on information in the case. Pay special attention to exhibits 8, 9, 16, &
17.
c.
Use estimated growth rates to find projected cash flow in years 2019-2027.
d.
Use free cash flow estimates, 1.2 billion shares, an 8% WACC, and a 2028 terminal value of $86
billion to determine a price per share in 2017.
Exhibit 7 Snap Inc. Cash Flow Statements, 2015-2017 12 months 6 months 12 months Dec-31-2015 USD Dec-31-2016 Jun-30-2017 USD USD For the Fiscal Period Ending Currency Net Income Depreciation & Amort. Amort. of Goodwill and Intangibles Depreciation & Amort., Total (372.9) 5.8 9.5 15.3 (514.6) 12.9 16.2 29.1 (2,651.9) 13.8 11.2 25.0 73.5 (7.1) (41.9) (6.7) 33.1 (306.6) 31.8 (7.1) (118.4) 6.5 (38.5 (611.2) 2,237.1 (3.4) (8.2) 9.3 27.5 (364.6) (19.2) (48.7) Stock-Based Compensation Other Operating Activities Change in Acc. Receivable Change in Acc. Payable Change in Other Net Operating Assets Cash from Ops. Capital Expenditure Cash Acquisitions Divestitures Sale (Purchase) of Intangible assets Invest. in Marketable & Equity Securt. Net (Inc.) Dec. in Loans Originated/Sold Other Investing Activities Cash from Investing Short Term Debt Issued Long-Term Debt Issued Total Debt Issued Short Term Debt Repaid Long-Term Debt Repaid Total Debt Repaid (66.4) (104.0) (0.6) (843.3) (37.4) (224.2) (7.7) (1,465.3) (9.1) (9.6) (14.4) (100.9) (7.0) (1,021.3) 9.9 (1,724.7) 5.0 5.0 (5.0) (5.0) 1,157.9 651.4 (1.0) (10.6) 2,658.6 (208.4) (5.4) 1,141.9 (9.4) 2,440.8 650.4 Issuance of Common Stock Repurchase of Common Stock Total Dividends Paid Special Dividend Paid Other Financing Activities Cash from Financing Net Change in Cash Supplemental Items Cash Interest Paid Cash Taxes Paid Levered Free Cash Flow Unlevered Free Cash Flow Change in Net Working Capital Net Debt Issued Filing Date 242.8 (490.7) 351.6 NA 0.0 NA NA NA NA Feb-02-2017 NA 1.7 (472.6) (471.7) 140.4 0 Feb-02-2017 NA 5.5 596.7 597.7 (44.9) NA Aug-11-2017 Currency Exchange Rate Conversion Method USD 1.0 H H USD 1.0 H USD 1.0 H Source: Company cash flow statements, Capital IQ, Inc., a division of Standard & Poor's. Exhibit 8 Snap Inc. Quarterly Average Daily Active Users QUARTERLY AVERAGE DAILY ACTIVE USERS (IN MILLIONS) Global 180 258 160 153 143 140 122 120 107 100 94 86 80 80 71 57 62 60 46 40 20 0 0 Q1 24 Q2 24 225% 23 24 142% % 24 24 104% QI 25 73% 22 25 51% 9375 52% 24 25 30% 9176 53% 0276 65% 23 76 62% 2476 48% 472% YOY growck Source: Snap, Inc. February 2, 2017 Form S-1 (filed February 2, 2017), p. 64, https://www.sec.gov/ Archives/edgar/data/1564408/000119312517029199/d270216ds1.htm, accessed November 2017. Exhibit 9 Snap Inc. Quarterly Average DAU by Region North America 68 65 61 54 48 44 38 40 80 70 60 50 40 30 20 10 0 35 30 32 26 il 11 g1 92 93 94 24 14 24 14 Q1 02 03 04 01 02 25 75 25 25 16 16 93 94 26 26 204% 152% 83% 85% 43% 32% 41% 39% 43% 54% 47% 40% Europe 60 52 49 50 46 38 40 34 27 29 30 30 23 18 20 20 14 10 0 Q1 02 03 04 01 02 03 04 01 02 03 04 '14 14 '14 '14 '15 '15 15 '16 16 16 13459367% 302% 136% 85% 37% 51% 47% 47% 80% 85% 53% '15 '16 Rest of World 39 39 36 29 24 45 40 35 30 25 20 15 10 5 0 18 20 16 11 13 9 6 QI 1402 1403 "1494 "1491 "1502 "1503"1504 '15QI 1692 1693 1694 16 1010%411% 280% 330% 182% 107% 87% 82% 83% 99% 88% 58% Source: Snap, Inc. February 2, 2017 Form S1 (filed February 2, 2017), p. 64, https://www.sec.gov/ Archives/edgar/data/1564408/000119312517029199/d270216ds1.htm, accessed November 2017. Exhibit 16a Snap Inc. Quarterly Average Revenue Per User (ARPU) $2.50 $2.00 $1.50 $1.00 $0.50 $0.00 Global North America Europe Rest of World 1Q1 2016 02 2016 03 2016 Q4 2016 01 2017 Source: Adapted from Facebook company documents cited in Alexei Oreskovic, "Look at the Big Gap Between Snapchat's Revenue Per User and Facebook's," Business Insider, http://www.businessinsider.com/snapchat-arpu-versus- facebook-arpu-charts-2017-5, accessed November 2017. Figures are unaudited. North America includes Mexico and the Caribbean. Europe includes Russia and Turkey. ARPU is defined as quarterly revenue divided by the average DAU. Note: 28 Exhibit 16b Facebook Quarterly Average Revenue Per User (ARPU) $20.00 $18.00 $16.00 $14.00 $12.00 $10.00 $8.00 $6.00 $4.00 $2.00 $0.00 Global U.S. & Canada Europe Asia-Pacific Rest of World 101 2016 Q2 2016 03 2016 04 2016 01 2017 Source: Adapted from Facebook company documents cited in Alexei Oreskovic, "Look at the Big Gap Between Snapchat's Revenue Per User and Facebook's," Business Insider, http://www.businessinsider.com/snapchat-arpu-versus- facebook-arpu-charts-2017-5, accessed November 2017. Exhibit 17 Comparison of Major Tech Companies at Time of IPO Quarter-over- Company Active Users Quarter Date Growth Facebook (Daily) 526 8.9% Mar-12 Twitter (Montly) 232 6,4% Sep-13 Snap (Daily) 158 3.3% Dec-16 Source: Adapted from Don Dion, "Beware of the Snap IPO: We Fear Its Value Could Disappear As Quickly As Its Messages." Seeking Alpha, March 1, 2017, https://seekingalpha.com/article/4050941-beware-snap-ipo-fear-value-disappear- quickly-messages, accessed November 2017 and Facebook Inc., Prospectus, (filed May 18, 2012): Twitter Inc., Prospectus, (filed November 7, 2013); Snap Inc., February 2, 2017 Form S1 (filed February 2, 2017), all accessed February 2018 Exhibit 7 Snap Inc. Cash Flow Statements, 2015-2017 12 months 6 months 12 months Dec-31-2015 USD Dec-31-2016 Jun-30-2017 USD USD For the Fiscal Period Ending Currency Net Income Depreciation & Amort. Amort. of Goodwill and Intangibles Depreciation & Amort., Total (372.9) 5.8 9.5 15.3 (514.6) 12.9 16.2 29.1 (2,651.9) 13.8 11.2 25.0 73.5 (7.1) (41.9) (6.7) 33.1 (306.6) 31.8 (7.1) (118.4) 6.5 (38.5 (611.2) 2,237.1 (3.4) (8.2) 9.3 27.5 (364.6) (19.2) (48.7) Stock-Based Compensation Other Operating Activities Change in Acc. Receivable Change in Acc. Payable Change in Other Net Operating Assets Cash from Ops. Capital Expenditure Cash Acquisitions Divestitures Sale (Purchase) of Intangible assets Invest. in Marketable & Equity Securt. Net (Inc.) Dec. in Loans Originated/Sold Other Investing Activities Cash from Investing Short Term Debt Issued Long-Term Debt Issued Total Debt Issued Short Term Debt Repaid Long-Term Debt Repaid Total Debt Repaid (66.4) (104.0) (0.6) (843.3) (37.4) (224.2) (7.7) (1,465.3) (9.1) (9.6) (14.4) (100.9) (7.0) (1,021.3) 9.9 (1,724.7) 5.0 5.0 (5.0) (5.0) 1,157.9 651.4 (1.0) (10.6) 2,658.6 (208.4) (5.4) 1,141.9 (9.4) 2,440.8 650.4 Issuance of Common Stock Repurchase of Common Stock Total Dividends Paid Special Dividend Paid Other Financing Activities Cash from Financing Net Change in Cash Supplemental Items Cash Interest Paid Cash Taxes Paid Levered Free Cash Flow Unlevered Free Cash Flow Change in Net Working Capital Net Debt Issued Filing Date 242.8 (490.7) 351.6 NA 0.0 NA NA NA NA Feb-02-2017 NA 1.7 (472.6) (471.7) 140.4 0 Feb-02-2017 NA 5.5 596.7 597.7 (44.9) NA Aug-11-2017 Currency Exchange Rate Conversion Method USD 1.0 H H USD 1.0 H USD 1.0 H Source: Company cash flow statements, Capital IQ, Inc., a division of Standard & Poor's. Exhibit 8 Snap Inc. Quarterly Average Daily Active Users QUARTERLY AVERAGE DAILY ACTIVE USERS (IN MILLIONS) Global 180 258 160 153 143 140 122 120 107 100 94 86 80 80 71 57 62 60 46 40 20 0 0 Q1 24 Q2 24 225% 23 24 142% % 24 24 104% QI 25 73% 22 25 51% 9375 52% 24 25 30% 9176 53% 0276 65% 23 76 62% 2476 48% 472% YOY growck Source: Snap, Inc. February 2, 2017 Form S-1 (filed February 2, 2017), p. 64, https://www.sec.gov/ Archives/edgar/data/1564408/000119312517029199/d270216ds1.htm, accessed November 2017. Exhibit 9 Snap Inc. Quarterly Average DAU by Region North America 68 65 61 54 48 44 38 40 80 70 60 50 40 30 20 10 0 35 30 32 26 il 11 g1 92 93 94 24 14 24 14 Q1 02 03 04 01 02 25 75 25 25 16 16 93 94 26 26 204% 152% 83% 85% 43% 32% 41% 39% 43% 54% 47% 40% Europe 60 52 49 50 46 38 40 34 27 29 30 30 23 18 20 20 14 10 0 Q1 02 03 04 01 02 03 04 01 02 03 04 '14 14 '14 '14 '15 '15 15 '16 16 16 13459367% 302% 136% 85% 37% 51% 47% 47% 80% 85% 53% '15 '16 Rest of World 39 39 36 29 24 45 40 35 30 25 20 15 10 5 0 18 20 16 11 13 9 6 QI 1402 1403 "1494 "1491 "1502 "1503"1504 '15QI 1692 1693 1694 16 1010%411% 280% 330% 182% 107% 87% 82% 83% 99% 88% 58% Source: Snap, Inc. February 2, 2017 Form S1 (filed February 2, 2017), p. 64, https://www.sec.gov/ Archives/edgar/data/1564408/000119312517029199/d270216ds1.htm, accessed November 2017. Exhibit 16a Snap Inc. Quarterly Average Revenue Per User (ARPU) $2.50 $2.00 $1.50 $1.00 $0.50 $0.00 Global North America Europe Rest of World 1Q1 2016 02 2016 03 2016 Q4 2016 01 2017 Source: Adapted from Facebook company documents cited in Alexei Oreskovic, "Look at the Big Gap Between Snapchat's Revenue Per User and Facebook's," Business Insider, http://www.businessinsider.com/snapchat-arpu-versus- facebook-arpu-charts-2017-5, accessed November 2017. Figures are unaudited. North America includes Mexico and the Caribbean. Europe includes Russia and Turkey. ARPU is defined as quarterly revenue divided by the average DAU. Note: 28 Exhibit 16b Facebook Quarterly Average Revenue Per User (ARPU) $20.00 $18.00 $16.00 $14.00 $12.00 $10.00 $8.00 $6.00 $4.00 $2.00 $0.00 Global U.S. & Canada Europe Asia-Pacific Rest of World 101 2016 Q2 2016 03 2016 04 2016 01 2017 Source: Adapted from Facebook company documents cited in Alexei Oreskovic, "Look at the Big Gap Between Snapchat's Revenue Per User and Facebook's," Business Insider, http://www.businessinsider.com/snapchat-arpu-versus- facebook-arpu-charts-2017-5, accessed November 2017. Exhibit 17 Comparison of Major Tech Companies at Time of IPO Quarter-over- Company Active Users Quarter Date Growth Facebook (Daily) 526 8.9% Mar-12 Twitter (Montly) 232 6,4% Sep-13 Snap (Daily) 158 3.3% Dec-16 Source: Adapted from Don Dion, "Beware of the Snap IPO: We Fear Its Value Could Disappear As Quickly As Its Messages." Seeking Alpha, March 1, 2017, https://seekingalpha.com/article/4050941-beware-snap-ipo-fear-value-disappear- quickly-messages, accessed November 2017 and Facebook Inc., Prospectus, (filed May 18, 2012): Twitter Inc., Prospectus, (filed November 7, 2013); Snap Inc., February 2, 2017 Form S1 (filed February 2, 2017), all accessed February 2018
Step by Step Solution
There are 3 Steps involved in it
Step: 1

Get Instant Access to Expert-Tailored Solutions
See step-by-step solutions with expert insights and AI powered tools for academic success
Step: 2

Step: 3
Ace Your Homework with AI
Get the answers you need in no time with our AI-driven, step-by-step assistance
Get Started