

Question
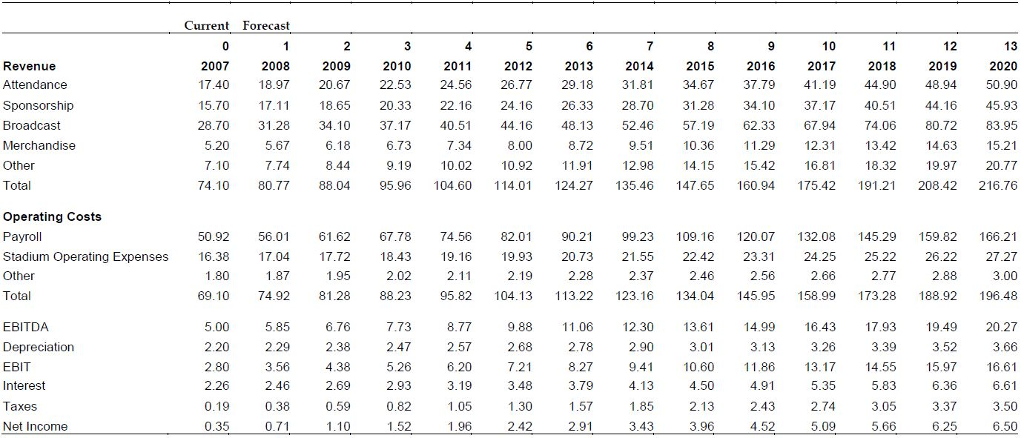
1. Assuming Tottenham Hotspurs continue in their current stadium following their current player strategy: Perform a DCF analysis using the cash flow projections given in
1. Assuming Tottenham Hotspurs continue in their current stadium following their current player strategy:
Perform a DCF analysis using the cash flow projections given in the case. Based on this DCF analysis, what is the value of the Hotspurs?
Perform a multiple analysis. Based on the multiples analysis, is the value of Tottenham any different?
At its current stock price of 13.80, is Tottenham fairly valued?
2. Using a DCF approach, evaluate each of the following decisions:
Build the new stadium
Sign a new striker
Build the new stadium and sign a new striker
3. Based on the results from 2, select a best choice and provide a logical argument to support it.
Hints:
There are multiple ways to find the answer; individual's answers may vary. Be sure to provide a logical reasoning for your assumptions.
Exhibit 5 provides values for Discounted Cash Flows
For DCF analysis, you will also need to include capital acquisitions by year and change the net working capital by year
You also need to determine a terminal value of the business (the present value of a perpetuity)
Use 10.25% as the discount rate
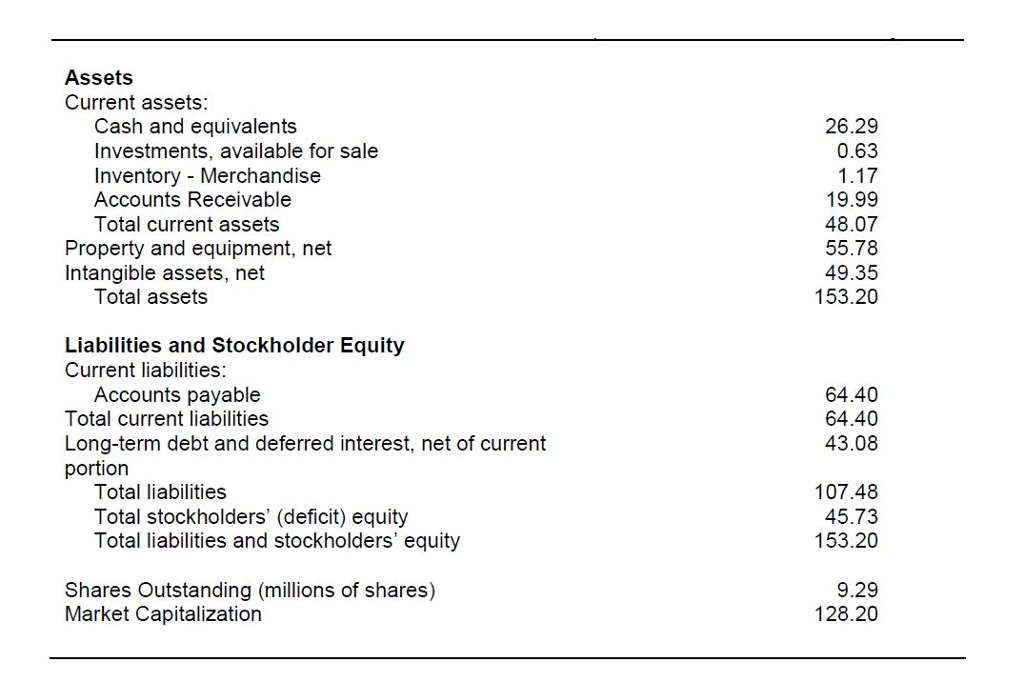
Remember to determine the value you will need to subtract the value for debt (this is shown in the set up spreadsheet posted as an announcement)
For adding a new stadium and new striker, you need to adjust your original DCF model and find the new cash flows. Remember to adjust for related revenues and expenses and recalculate the value of the enterprise.
For the new striker scenario, the problem indicates that the striker would be responsible for an increase in 12 goals per season, but how does this translate into new revenue? As this calculation is a little beyond the scope of this course, I am providing the attached calculation of incremental player revenue that you can use. It uses base line revenue to calculate striker incremental revenue.
It assumes that those 12 goals translate into a 25% increase in revenue, but that 25% is limited by the 20% that the new striker is expected to be injured and is limited by the 25% of the revenue that can be leveraged in the old stadium. Accordingly, you may use the following numbers from the attached spreadsheet for the new striker incremental revenue.
| 4.04 | 4.40 | 4.80 | 5.23 | 5.70 | 6.21 | 6.77 | 7.38 | 8.05 | 8.77 |
Attached is a spreadsheet showing the base case set up for Tottenham. This spreadsheet does not include any formulas--only numbers. I am providing this so you can check your spreadsheet numbers. You need to have something similar to this that operates by formula so you can copy it and modify it for the player, stadium and both alternatives. Also included as a second tab is a partial spreadsheet for the stadium to show how you might want to alter the base case spreadsheet for the alternative cases.
Also, below is some additional direction on the case. Some of this was contained in earlier announcements and some is new. While you are working the problem, please feel free to email me with questions.
The Tottenham problem is a Discounted Cash Flow analysis.
What data do we need to conduct a DCF analysis? For the base case set up, we need:
1. To calculate free cash flows
a. Income Statement (in Tottenham problem)
i. EBIT
ii. Depreciation
iii. Taxes (EBIT * Tax Rate)
b. Balance Sheet
i. Change in NWC For the Tottenham problem, we are going to calculate NWC for year 0 and year 1 and calculate change in NWC then assume that NWC changes in relationship to the changes in revenue. You can assume NWC in Year 0 is (43.24).
ii. CapEx The problem says that in year 0, the team expects 3.3 M in capital maintenance and that this cost will grow at 4%. This will serve as the basis for the CapEx.
2. To calculate a terminal value
a. Discount Rate the Discount Rate for the problem is 10.25%
b. Growth Rate the Growth Rate in year 13 is 4%
c. Steady State Cash Flow years 1 through 12 are the growth period for Tottenham and year 13 is steady state. Accordingly, the FCF from year 13 should be used to calculate the terminal value.
3. To find the net present value of the FCF
a. Discount Rate the Discount Rate for the problem is 10.25%
b. FCF and Terminal Value the best way to set this up is to calculate FCF for years 1 through 13. Use year 13 to calculate the terminal value. Link the terminal value calculation to the cell below the year 12 FCF. Create a new row that is each years FCF plus the terminal value row (you will only have a terminal value for year 12). This will produce a single row of cash flows that can be included in an excel NPV function.
Once you have set up the base case, you need to copy the base case to a new sheet/tab and modify the spreadsheet to reflect the impact of building a new stadium, signing a new player and doing both.
Stadium
The new stadium project has a number of impacts on cash flow including
Income Statement Impacts (these will flow through to your FCF EBIT starting number)
Incremental Attendance Revenues for all years
Incremental Sponsorship Revenues for all years
Incremental Operating Costs for all years
Increased Depreciation over the 10 year life of the stadium
Impacts not reflected in EBIT and that will have to be reflected in FCF calculation
Capex of stadium build costs in year 1 and 2
At the Stadium tab of the attached spreadsheet, it shows one way to set up the spreadsheet to accomplish this. If your base case works correctly and the formulas are adjusted to capture the incremental impacts, those incremental impacts should flow through to FCF, enterprise value and stock valuation.
Player and Both
The new player has similar direct and indirect impacts as the stadium and you will find these impacts in the problem narrative. For both these scenarios, you will also copy the base case spreadsheet and make adjustments. Make sure that you understand the limitation on new player revenue associated with playing at the old stadium.
 There is no cost associated with building the stadium. Only costs associated with the stadium are operating cost (payroll, stadium operating expenditure)
Step by Step Solution
There are 3 Steps involved in it
Step: 1

Get Instant Access to Expert-Tailored Solutions
See step-by-step solutions with expert insights and AI powered tools for academic success
Step: 2

Step: 3
Ace Your Homework with AI
Get the answers you need in no time with our AI-driven, step-by-step assistance
Get Started
Benefits Management How To Increase The Business Value Of Your IT Projects
Authors: John Ward, Elizabeth Daniel
2nd Edition
1119993261, 9781119993261