

Question
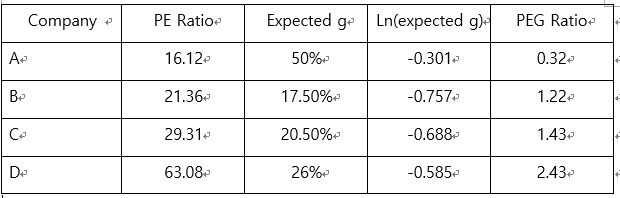
1. Based on PEG ratios alone, determine under-valued and over-valued stocks (as commonly used by financial analysts). 2. The relation between PEG and expected g
1. Based on PEG ratios alone, determine under-valued and over-valued stocks (as commonly used by financial analysts).
2. The relation between PEG and expected g is non-linear. The relation is estimated with the natural log of the expected growth rate:
PEG = -0.2 1.9*ln(expected g) R2 = 45%
Using the above regression result, find predicted PEG for each company and discuss the results compared to your answer in (1).
Company - PE Ratio- Expected ge Ln(expected g) PEG Ratio 16.12- 50% -0.301 0.32- B- 21.364 17.50%- -0.7572 1.224 CH 29.31- 20.50%- -0.688- 1.434 De 63.08- 26% -0.5854 2.432Step by Step Solution
There are 3 Steps involved in it
Step: 1

Get Instant Access to Expert-Tailored Solutions
See step-by-step solutions with expert insights and AI powered tools for academic success
Step: 2

Step: 3
Ace Your Homework with AI
Get the answers you need in no time with our AI-driven, step-by-step assistance
Get Started
Essentials Of Working Capital Management
Authors: James Sagner
1st Edition
047087998X,0470916923