

Answered step by step
Verified Expert Solution
Question
1 Approved Answer
1. Based on the table above, calculate the marginal utilities for T-Shirts and Movies. 2. Draw a graph of the quantity and total utility

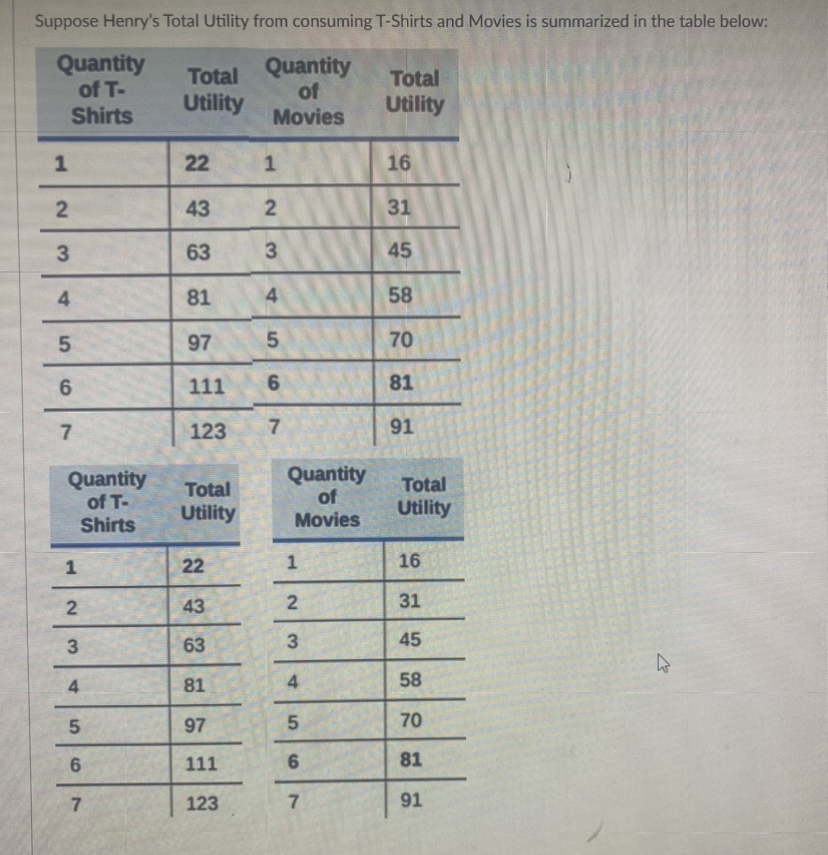
1. Based on the table above, calculate the marginal utilities for T-Shirts and Movies. 2. Draw a graph of the quantity and total utility for T-Shirts and Movies. 3. Draw a graph of the quantity and marginal utility for T-Shirts and Movies. 4. Suppose T-Shirts cost $5, Movies cost $3, and Henry has $20 dollars to spend. How many T-shirts and Movies will Henry purchase if he is willing to spend $20 and earns zero utility from saving? Please show all your work and explain your answer. Hint: Use the utilities from the table above, and your result from parti. Suppose Henry's Total Utility from consuming T-Shirts and Movies is summarized in the table below: Quantity Total Quantity Total of T- of Utility Shirts Utility Movies 1 22 1 16 2 43 2 31 3 63 3 45 4 81 4 58 5 97 5 70 6 111 6 81 7 123 7 91 Quantity Quantity Total Total of T- of Utility Utility Shirts Movies 1 22 1 16 2 43 2 31 3 63 3 45 4 81 4 58 5 97 5 70 6 111 6 81 7 123 7 91 1
Step by Step Solution
There are 3 Steps involved in it
Step: 1

Get Instant Access to Expert-Tailored Solutions
See step-by-step solutions with expert insights and AI powered tools for academic success
Step: 2

Step: 3
Ace Your Homework with AI
Get the answers you need in no time with our AI-driven, step-by-step assistance
Get Started
Econometric Analysis
Authors: William H. Greene
5th Edition
130661899, 978-0130661890