Question
1) Before getting into BOP analysis, you need to provide a brief economical description of the assigned country. In your description, you may discuss points
1) Before getting into BOP analysis, you need to provide a brief economical description of the assigned country. In your description, you may discuss points such as the components of GDP, growth rate, interest and inflation figures, macroeconomic policies applied by the government, and Central Bank policies. You may also discuss the primary drivers of the economy. For Japan, you may discuss that interest rates are almost zero as a Central Bank tool and that Japan is a saving-based economy, etc.
Shortly, you are asked to offer a profile of the assigned country’s economical condition in various aspects.
2) You need to analyze BOP figures from both time series and cross-sectional viewpoints. That is, in time series analysis, you need to examine the changes of a BOP item (for eg. Export) over the given years and report any significant changes over the years if there is any. If there is no significant change (you can use the benchmark of more than 10-15% annual change as significant), you may report the following sentence as an example: “The export figures of .... tend to be stable over the 2010-2022 period”.
In cross-sectional analysis, you need to analyze a single year’s BOP items. That is, for any year, you need to make a top to bottom analysis starting from the export figures of each country. A sample cross-sectional report may include such statements:
“ In 2021 USA experiences a ..... $ of trade deficit. However, including other items, overall Current Account deficit increases/decreases to...$”. If there is a big gap between Trade Balance and the Current Account Balance, you may need to explain why. 3) In your comments and interpretations, you might need to do some external research regarding that country’s general economical, financial as well as political conditions prevailing at the relevant time period. For example, BOP figures for Japan would have some interrelation with BOP figures for the USA. For your research about countries, the main source to be used could be IMF’s web page and country reports for the associated time periods. (www.imf.org). You may also use the Central Bank web pages of the countries to get further information regarding a particular country’s economic policies and other relevant information. You can and might need to use some other sources such as World Bank and etc.
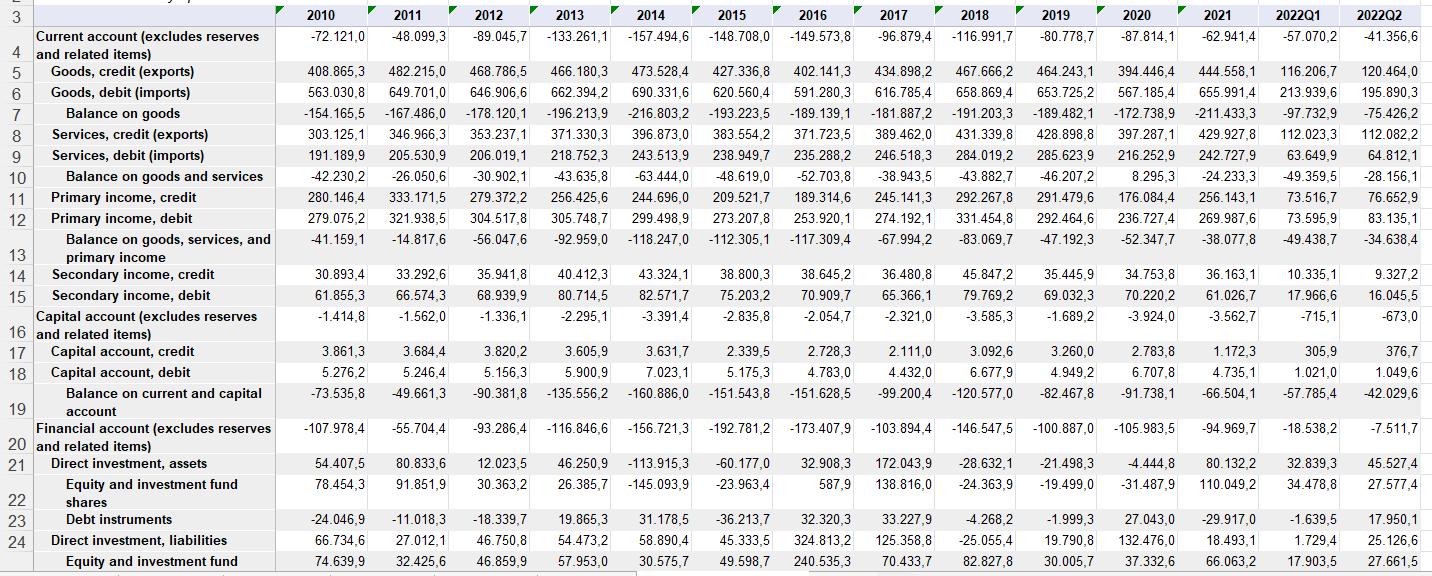
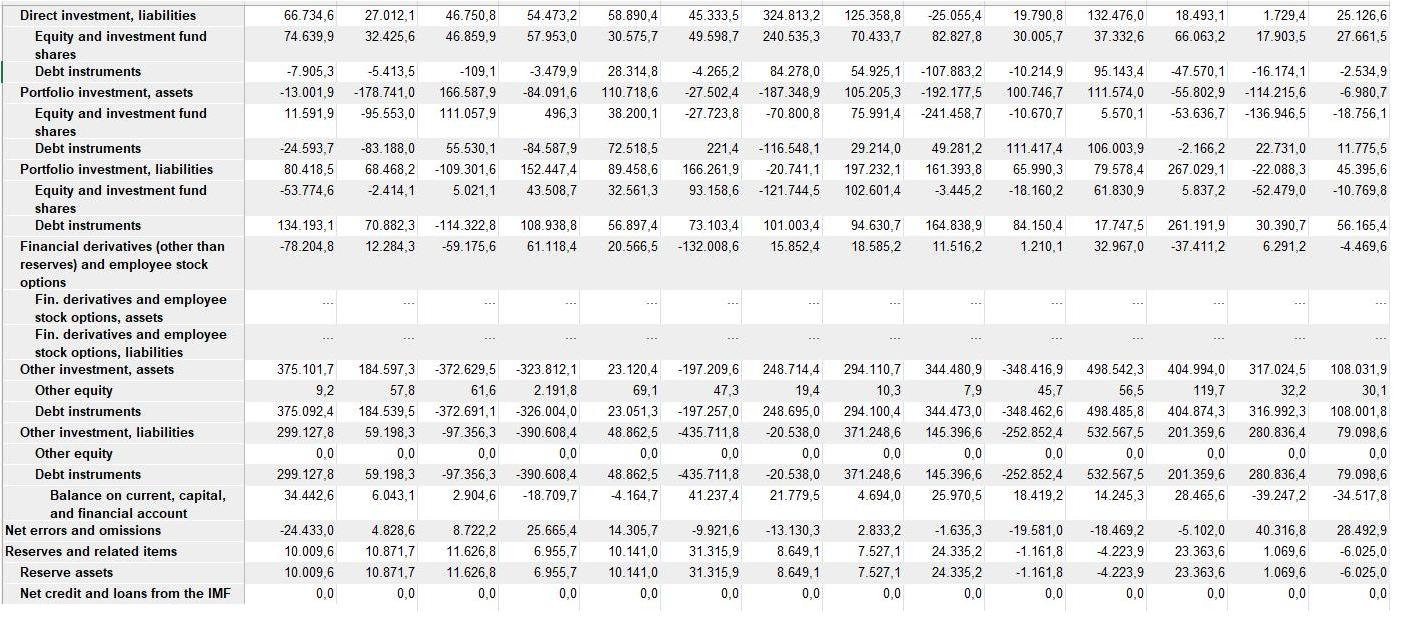
Compare the bop data here with each other and prepare short comments.


3 4 and related items) 5 Goods, credit (exports) 6 7 8 9 10 11 12 13 14 Current account (excludes reserves Balance on goods and services Primary income, credit Primary income, debit Balance on goods, services, and primary income Secondary income, credit 15 Secondary income, debit Goods, debit (imports) Balance on goods Services, credit (exports) Services, debit (imports) 22 23 24 Capital account (excludes reserves 16 and related items) 17 18 19 Capital account, credit Capital account, debit Balance on current and capital account Financial account (excludes reserves 20 and related items) 21 Direct investment, assets Equity and investment fund shares Debt instruments Direct investment, liabilities Equity and investment fund 120.464,0 2015 2016 2019 2020 -148.708,0 -149.573,8 -80.778,7 -87.814,1 408.865,3 482.215,0 468.786,5 466.180,3 473.528,4 427.336,8 402.141,3 434.898,2 467.666,2 464.243,1 394 446,4 444.558,1 116.206.7 563.030,8 649.701,0 646.906,6 662.394,2 690.331,6 620.560,4 591.280,3 616.785,4 658.869,4 653.725,2 567.185,4 655.991,4 213.939,6 195.890,3 -154.165,5 -167.486,0 -178.120,1 -196.213,9 -216.803,2 -193.223,5 -189.139,1 -181.887,2 -191.203,3 -189.482,1 -172.738,9 -211.433,3 -97.732,9 -75.426,2 303.125,1 346.966,3 353.237,1 371.330,3 396.873,0 383.554,2 371.723,5 389.462,0 431.339,8 428.898,8 397.287,1 429.927,8 112.023,3 112.082,2 191.189,9 205.530,9 206.019,1 218.752,3 243.513,9 238.949,7 235.288,2 246.518,3 284.019,2 285.623,9 216.252,9 242.727,9 63.649,9 64.812,1 -42.230,2 -26.050,6 -30.902,1 -43.635,8 -63.444,0 -48.619,0 -52.703,8 -38.943,5 -43.882,7 -46.207,2 8.295,3 -24.233,3 -49.359,5 -28.156,1 280.146,4 333.171,5 279.372,2 256.425,6 244.696,0 209.521,7 189.314,6 245.141,3 292.267,8 291.479,6 176.084,4 256.143,1 73.516,7 279.075,2 321.938,5 304.517,8 305.748,7 299.498,9 273.207,8 253.920,1 274.192,1 331.454,8 292.464,6 236.727,4 269.987,6 73.595,9 -41.159,1 -14.817,6 -56.047,6 -92.959,0 -118.247,0 -112.305,1 -117.309,4 -67.994,2 -83.069,7 -47.192,3 -52.347,7 -38.077,8 -49.438.7 76.652,9 83.135,1 -34.638,4 2010 -72.121,0 -107.978,4 2011 -48.099,3 3.861,3 3.684,4 5.276,2 5.246,4 -73.535,8 -49.661,3 54.407,5 78.454,3 30.893,4 33.292,6 35.941,8 61.855,3 66.574,3 68.939,9 -1.562,0 -1.336,1 -1.414,8 -55.704,4 2013 2012 -89.045,7 -133.261,1 80.833,6 91.851,9 3.820,2 5.156,3 -90.381,8 -93.286,4 12.023,5 30.363,2 2014 -157.494,6 40.412,3 43.324,1 38.800,3 38.645,2 80.714,5 82.571,7 75.203,2 70.909,7 -2.295,1 -3.391,4 -2.835,8 -2.054,7 3.605,9 3.631,7 2.339,5 5.900,9 7.023,1 5.175,3 -135.556,2 -160.886,0 -151.543,8 -116.846,6 -156.721,3 46.250,9 -113.915,3 26.385,7 -145.093.9 19.865,3 31.178,5 -24.046,9 -11.018,3 -18.339,7 66.734,6 27.012,1 46.750,8 54.473,2 58.890,4 74.639,9 32.425,6 46.859,9 57.953,0 30.575,7 49.598,7 2017 2018 -96.879,4 -116.991,7 2.728,3 2.111.0 4.783,0 4.432,0 -151.628,5 -99.200,4 36.480,8 45.847,2 65.366,1 79.769,2 -2.321,0 -3.585,3 -36.213,7 32.320,3 33.227,9 45.333,5 324.813,2 125.358,8 240.535,3 70.433,7 -192.781,2 -173.407,9 -103.894,4 -60.177,0 32.908,3 172.043,9 -28.632,1 -21.498,3 -23.963,4 587,9 138.816,0 -24.363,9 -19.499,0 -4.268,2 -25.055,4 82.827,8 2021 -62.941,4 3.092,6 1.172,3 6.677,9 -120.577,0 3.260,0 2.783,8 4.949,2 6.707,8 -82.467,8 -91.738,1 4.735,1 -66.504,1 -146.547,5 -100.887,0 -105.983,5 -94.969,7 -4.444,8 80.132.2 -31.487,9 110.049,2 35.445,9 34.753,8 36.163,1 10.335,1 69.032,3 70.220,2 61.026,7 17.966,6 -1.689,2 -3.924,0 -3.562,7 -715,1 2022Q1 2022Q2 -57.070,2 -41.356,6 305,9 1.021,0 -57.785,4 -18.538,2 32.839.3 34.478.8 -1.999,3 27.043,0 -29.917,0 -1.639,5 19.790,8 132.476,0 18.493,1 1.729,4 30.005,7 37.332,6 66.063,2 17.903,5 9.327,2 16.045,5 -673,0 376,7 1.049,6 -42.029,6 -7.511,7 45.527,4 27.577,4 17.950,1 25.126,6 27.661,5
Step by Step Solution
3.34 Rating (160 Votes )
There are 3 Steps involved in it
Step: 1
Time Series Analysis Current Account The current account balance has been fluctuating in recent years with a high of 878 billion in 2020 and a low of ...
Get Instant Access to Expert-Tailored Solutions
See step-by-step solutions with expert insights and AI powered tools for academic success
Step: 2

Step: 3

Ace Your Homework with AI
Get the answers you need in no time with our AI-driven, step-by-step assistance
Get Started


