

Answered step by step
Verified Expert Solution
Question
1 Approved Answer
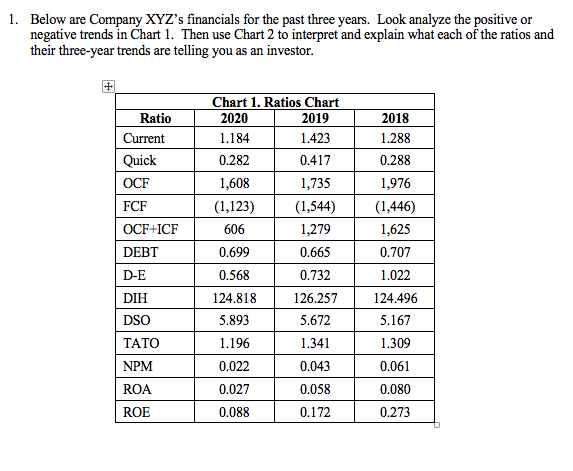
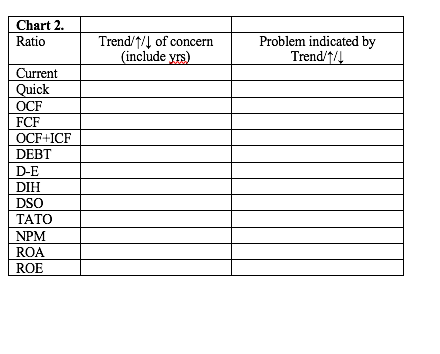
1. Below are Company XYZ's financials for the past three years. Look analyze the positive or negative trends in Chart 1. Then use Chart
-
 \
\
1. Below are Company XYZ's financials for the past three years. Look analyze the positive or negative trends in Chart 1. Then use Chart 2 to interpret and explain what each of the ratios and their three-year trends are telling you as an investor. + Ratio Current Quick OCF FCF OCF+ICF DEBT D-E DIH DSO TATO NPM ROA ROE Chart 1. Ratios Chart 2020 2019 1.184 1.423 0.282 0.417 1,608 1,735 (1,123) (1,544) 606 1,279 0.699 0.665 0.568 0.732 124.818 126.257 5.893 5.672 1.196 1.341 0.022 0.043 0.027 0.058 0.088 0.172 2018 1.288 0.288 1,976 (1,446) 1,625 0.707 1.022 124.496 5.167 1.309 0.061 0.080 0.273 Chart 2. Ratio Trend/1/1 of concern (include yrs) Problem indicated by Trend/144 Current Quick OCF FCF OCF+ICF DEBT D-E DIH DSO TATO NPM ROA ROE 1. Below are Company XYZ's financials for the past three years. Look analyze the positive or negative trends in Chart 1. Then use Chart 2 to interpret and explain what each of the ratios and their three-year trends are telling you as an investor. + Ratio Current Quick OCF FCF OCF+ICF DEBT D-E DIH DSO TATO NPM ROA ROE Chart 1. Ratios Chart 2020 2019 1.184 1.423 0.282 0.417 1,608 1,735 (1,123) (1,544) 606 1,279 0.699 0.665 0.568 0.732 124.818 126.257 5.893 5.672 1.196 1.341 0.022 0.043 0.027 0.058 0.088 0.172 2018 1.288 0.288 1,976 (1,446) 1,625 0.707 1.022 124.496 5.167 1.309 0.061 0.080 0.273 Chart 2. Ratio Trend/1/1 of concern (include yrs) Problem indicated by Trend/144 Current Quick OCF FCF OCF+ICF DEBT D-E DIH DSO TATO NPM ROA ROE
\Step by Step Solution
There are 3 Steps involved in it
Step: 1

Get Instant Access to Expert-Tailored Solutions
See step-by-step solutions with expert insights and AI powered tools for academic success
Step: 2

Step: 3
Ace Your Homework with AI
Get the answers you need in no time with our AI-driven, step-by-step assistance
Get Started
Ethics In Finance
Authors: John R. Boatright
3rd Edition
1118615824, 978-1118615829