

Question
1. Bonds On October 1, 2020, Proximo, Inc. issued $2,420,000 par value, 5%, 12-year bonds, with interest payable semiannually on January 1 and July 1.
1. Bonds On October 1, 2020, Proximo, Inc. issued $2,420,000 par value, 5%, 12-year bonds, with interest payable semiannually on January 1 and July 1. The bonds originally sell for $2,132,240, to yield 7%. The straight-line amortization method is used by Proximo to account for any bond discount or premium. a).Were these bonds issued at a discount or premium to par? If so, what is the amount? b).Prepare the journal entry required at bond issuance. c). Prepare the adjusting journal entry at December 31, 2020, the end of the fiscal year. d).Prepare the journal entry for the interest payment on January 1, 2021. e).Prepare the journal entry for the interest payment on July 1, 2021. Assume no entries have been made since the January 1 entry.
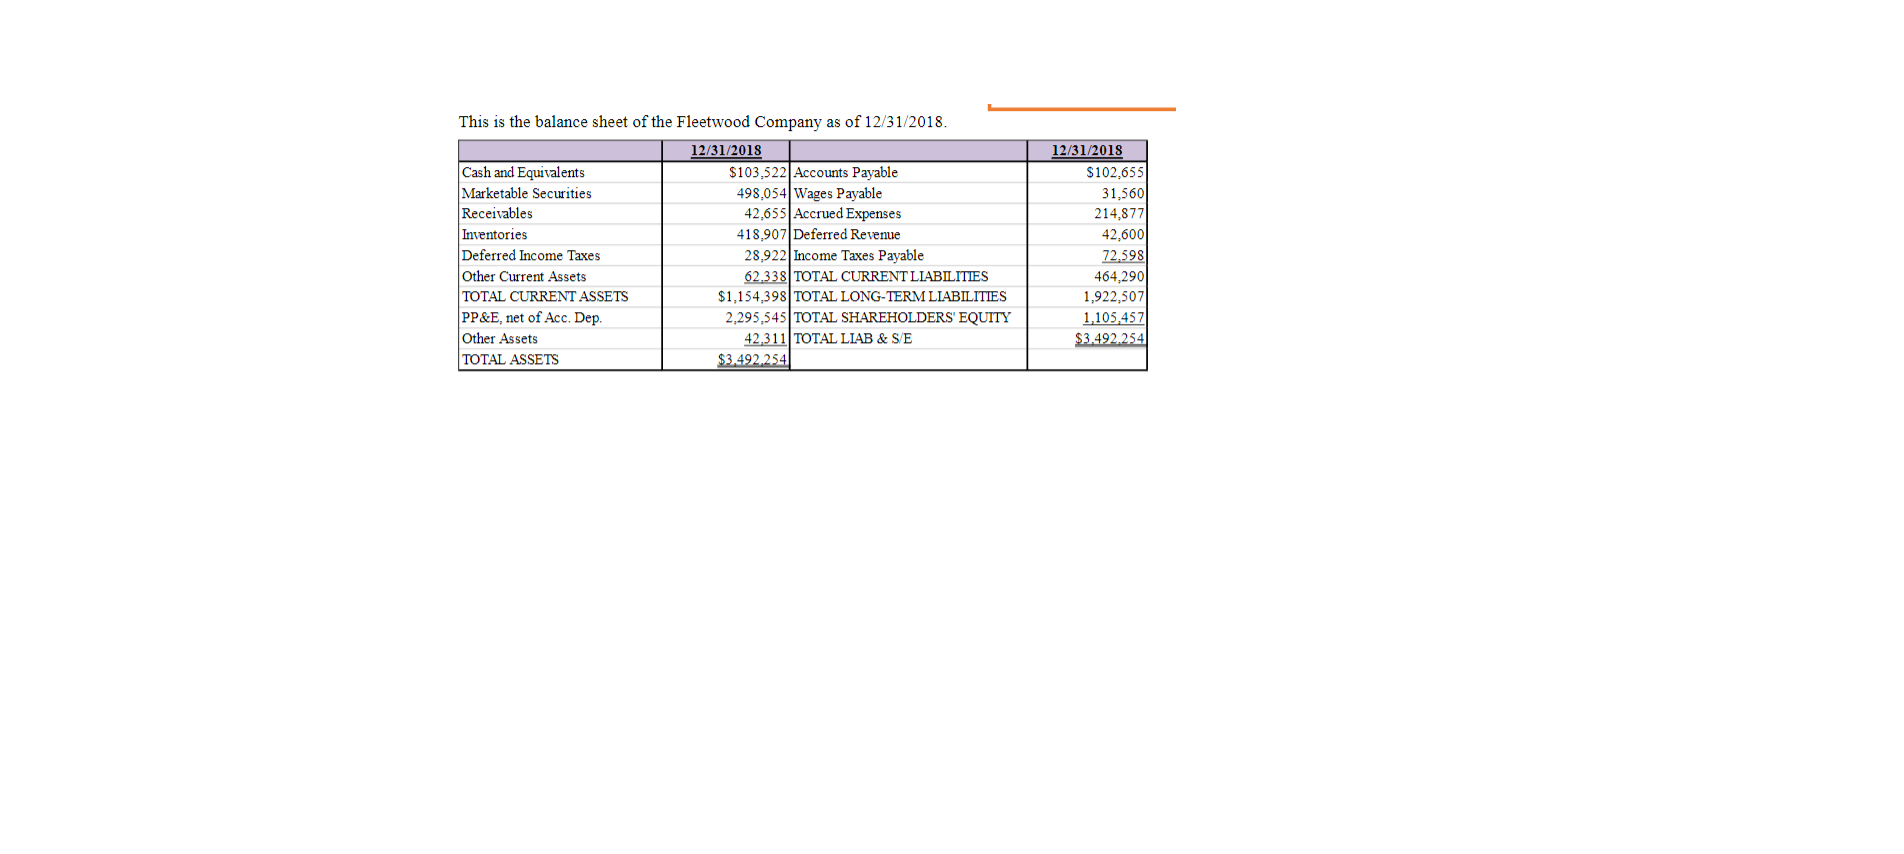
2. (use the picture below) Compute the Quick Ratio: (Use same formula as earlier discussed, ignore deferred income taxes in computations)
If industry average is 2.0, how is Fleetwood doing compared to the industry?
Recall that Current ratio is Current Assets Current Liabilities. Why do some people prefer the Quick ratio to the Current ratio?
Compute the Debt Ratio: Total liabilities Total Assets
Lets say that the industry average is 50%. Does that mean that Fleetwood has higher or lower leveragethan its competitors? Are higher or lower numbers better?
Compute the Debt-to-Equity Ratio: Total liabilities Total Stockholders Equity
If the industry average is 3.2, does that mean that Fleetwood has higher or lower leverage than its competitors? Are higher or lower numbers better?
Step by Step Solution
There are 3 Steps involved in it
Step: 1

Get Instant Access to Expert-Tailored Solutions
See step-by-step solutions with expert insights and AI powered tools for academic success
Step: 2

Step: 3
Ace Your Homework with AI
Get the answers you need in no time with our AI-driven, step-by-step assistance
Get Started
Financial Reporting Under Ias Ifrs Theoretical Background And Capital Market Evidence A European Perspective
Authors: Vera Palea, Peter Lang
1st Edition
9783034314039, 3034314035