

Question
(1 bookmark) Show transcribed image textView comments (1) Expert Answer (1 bookmark) Flag Required Information In this mini-case you will complete the preliminary analytical procedures
(1 bookmark)
Show transcribed image textView comments (1)
Expert Answer
(1 bookmark) Flag Required Information In this mini-case you will complete the preliminary analytical procedures for the 2016 audit of EarthWea Intangibles.net Total 5628 5295527 0215 100.00 $123 $320.00 019% 100 DO 5218 $300 OON 10000% $1.734 5589.423 0.49% 100006 515 For the perod ended December 31 2014 2018 Expected Dollar SoSan Dollar No Sai DollarVale SofSales Net Saire 157815 1000W 05.4 December 31 2012 2013 2014 2015 2015 2016 Actual (Audited) (Audited) (Audited) Audited) Expected fundid) Difference from Expe - Expected values are obtained by using the forecast function in Excel (using the row of data tom 2012 and 2016 no ceturn the O This qu Required information nature of the testing to address the increased risk. SHORT-TERM LIQUIDITY RATIOS: ACTIVITY RAT 2. Assessment of Financial Position Based on your review of Work Paper 5-4, assess the clients ability to continue as a goin Show transcribed image text View comments (1) Expert Answerinformation icon
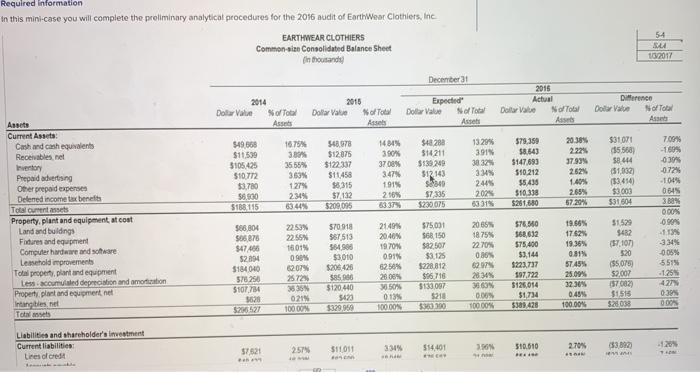
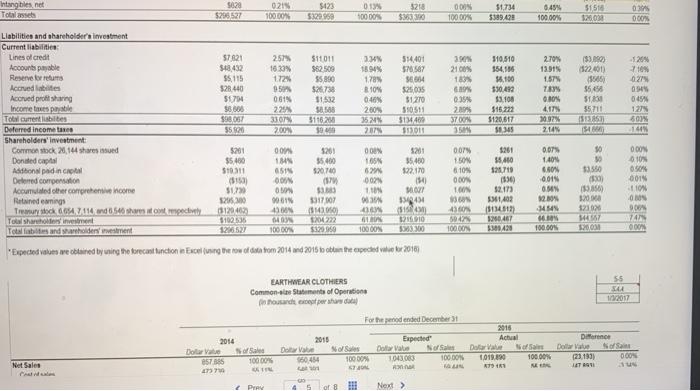
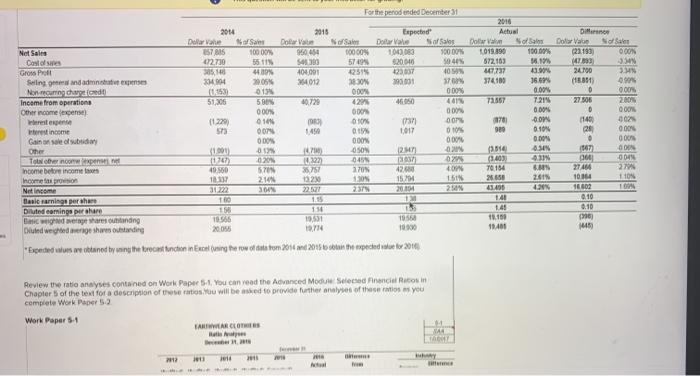
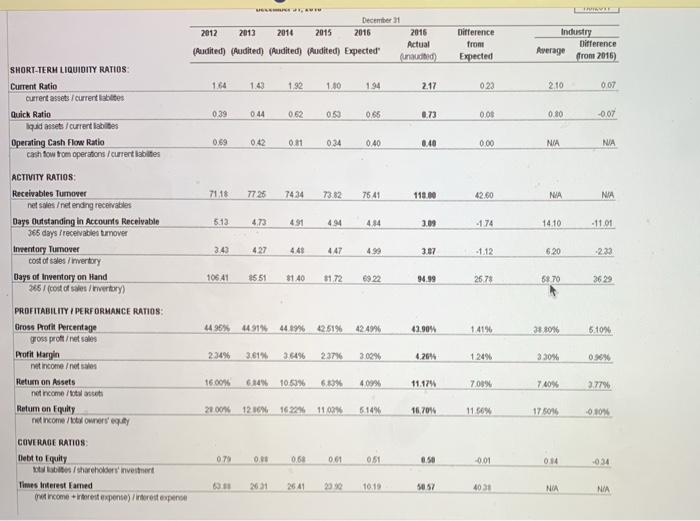
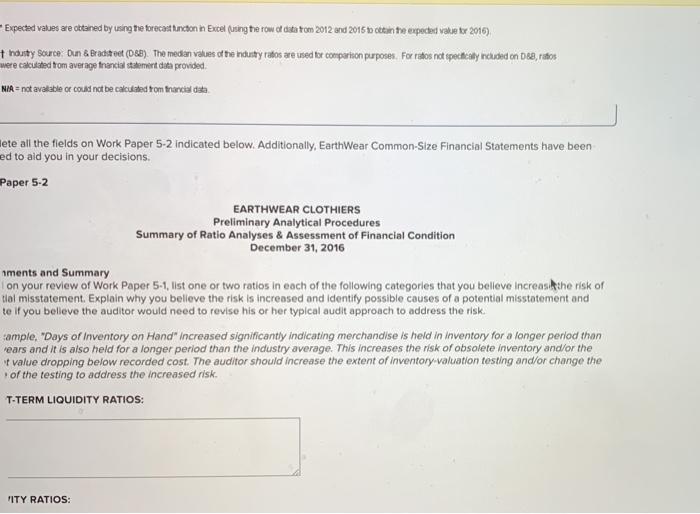
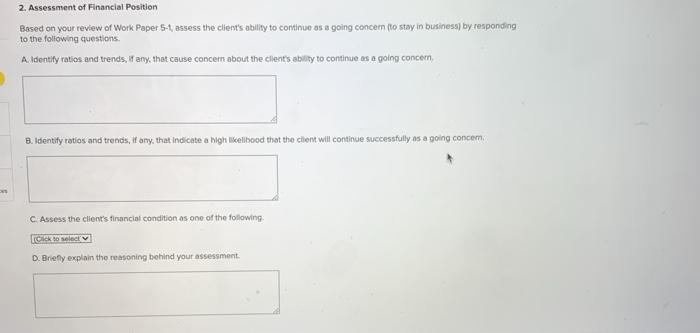
Required Information In this mini-case you will complete the preliminary analytical procedures for the 2016 audit of EarthWear Clothiers. Inc EARTHWEAR CLOTHIERS Commons Consolidated Balance Sheet | in Dousands 54 10/2017 December 31 2014 DollarValue SofTool Assets 2015 Dollar Value of Total Assets Expected DollarValue NoTotal Assets 2015 Actual DollarValue NoTool Ass Difference Dote Value NoTotal Asset 549 568 $11,590 3105.425 $10.772 $3.780 55.000 S18115 1679% 38% 35 55% 353% 127 234% 63407 548.978 $12.875 $122.337 $11.458 $5,315 $74132 5200095 1481 30% 3708% 3.47 $48282 514211 $139.249 512143 S40 $7,335 S230.675 13.29% 3915 30323 3 2444 2024 6331 579.350 $8.54) $147,693 $10.212 $5,430 $10.338 5261.680 20,38% 2.321 37939 2.62% 1.405 265% 57.2013 $31.071 $5568) 58.444 51,032 (53.454 $3000 $31504 1915 210 Assets Current Assets Cash and cash equivalents Receivables.net Inventory Prepaid advertising Other prepaid expenses Delenred income tax benefits Totalcuments Property, plant and equipment at cost Land and buiding Fitures and equipment Computer hardware and software Les hold improvements Total property, plant and equipment Les coumised depreciation and emotion Property, plant and equipment net Intangibles et Total 568,804 586878 34701 200 1875 22.70% $200 70% -1895 0305 -072% 104% 0.64% 30% 0.00% OSON - 113 3344 -0.05% 5515 -125 42 0394 0.00% OBOX 22:53 22.55 1801% 090 6207 25725 335 021 100 ON $184040 576256 5107,784 3628 570918 567513 $84.990 $3.010 S205 426 3856 $120440 5423 $329.90 2149 20.40% 1970% 0.91% 6250 2000 0509 0199 100.00% $75,000 568150 $82.507 $3.125 5228,812 $96718 $133.097 $210 $380.00 576.50 568,632 575.400 $3,144 $223,737 197.722 $125,014 $1,734 $389.428 6297 28 30% 35.00 0.00 100005 51520 $482 (57.107 520 $5,075) $2.007 57082 $1515 52000 19.66% 1762 19.36% 0.31% 5745% 25.09% 32309 0.49% 100.00% Liabilities and shareholder's Investment Current liabilities: Lines of credit 2.57% $11011 3349 2.70% 3.50 514401 57521 510.610 $3822 120 1. BE Intangibles.net Total 5628 5295527 0215 100.00 $123 $320.00 019% 100 DO 5218 $300 OON 10000% $1.734 5589.423 0.49% 100006 51510 26.020 03 000 21.00% 18 $7621 548432 55. 115 528.440 574 $8006 $98.01 5520 257 16.30 172 9 0618 225 Liabilities and shareholder investment Current liabilities Lines of credit Accounts payable Reserveren Acord labies Accrued protsharing Incometes pale Tourensbites Deferred income taxes Shareholders investment Common stock 21,144 shares issued Donated capital Adonlading Deferred compensation Accumulated other comprehensive Income Rated wings Tremur tick 004.711 and 6,540 share it on mely To Sharing investment Total and rhodenwestment 511011 $82.500 55,860 $26.738 51532 30 3116290 19 3. 1894 178 8.10% 040 2009 352 287 514401 570507 36604 $250 $1.270 59051 510,510 154.136 56.100 530492 $3100 $15222 $120.617 58345 270 13.915 1.57% 783 OMON 4.17 3097 2.14% 0.35 2001 37001 35 $3.00 122.401) 1505 $5.50 S100 35711 1313 SM 120% 710 027 0.94% 045 127 801 1401 2009 $200 SO 5201 35.400 520700 000 010 $5.50 521 35.400 122.170 154 ON 165 620 002 110 S10311 ($150 517 120630 3120403 000 14 651 GON ON 90618 45 ON 10000 13.550 007 150% 610 000 TON 333 331701 2.000 120422 205 1261 55,400 12.715 0536 $2.173 11402 (313413 0467 3300428 0.07 1 404 6.80 0.01 ON 2009 34 HON 100 os 3.560 12000 523920 544157 549414 SID 10 2015 10 ON Door 741 ODON 0 4300 504 1206527 10000 Expected values webised by using the forecast function in Bolunghe tow of enton 2014 and 2016 boton he expected vier 2016 55 10/2017 EARTHWEAR CLOTHERS Common Statements of Operations foarte per te For the pended December 2015 Expected Do NOS Do Value Nora 10000 0454 10000 1043.000 100.00 2016 Actual 2014 Dollar of 100.00% De Sofa 23.1931 OOON LAT 190 Net Sales OSTS 4 PER 5 of Next > For the perod ended December 31 2016 2014 2018 Expected Actual Dance Dollar SoSan Dollar No Sai DollarVale SofSales Dobra Sofa Dotar Vale Net Saire Sofa 157815 1000W 05.454 100005 100.000 9000 1019.890 100.00% (23193 000N Coloses 02.739 55 IN SA380 579 $20.040 50.47% 572103 361 1473 -35 Gross Poll 48% 104.001 2515 123007 40 47737 13.90 2400 Selling and admin 334 904 2005 94011 380N 190.001 17 374100 36.67% (1981) Non sono colored 0532 01 OD ODON 0.00% 0 0.00 Income from operations 51.306 50% 10.720 420 co 73.867 T215 27.08 2.00 Other income 000% 000 0.00% 0 0006 Wherente pense 11.220 010 93 0.1% 37 or 270 -0.0 1140 3025 interest income 00 1450 Q 017 0106 020 0.10 20 000 Gainon solo 00% 000 000 0.00 000 Other (1.000 01 OSON 21 4.30 GON To become 1100 20201 10222 02 (140) IN 000 004 Income before income 40.560 STON 35757 2705 42.60 76184 27464 279 Income 1313 2108 12 10 15701 151 26650 2013 1014 1109 Netnom 31222 307 22 2.375 41.400 420 16602 Basi namninga perahan 1.15 141 Diluted earnings per har 150 110 148 0.10 DC Westware untanding 18:56 19,551 12.150 1996 Dluindwerge share outstanding 2005 12.74 10000 1940 Expeded in othened by any the recent tinchen in Excelsing the row of tatom 2011 and 2015 on the wedde 2010 Review the ratio anayses contained on Work Paper 5-4 You can read the Advanced Mouse Selected Financial Recoin Chapter of the text for a description of the ratio ou will be asked to provide further analyses of these iss you complete Work Paper 52 Work Paper 5.1 TAWAR CLOTHES Het VA WAY 2013 December 31 2012 2013 2014 2015 2015 2016 Actual (Audited) (Audited) (Audited) Audited) Expected fundid) Difference from Expected Industry Difference Average from 2016) 1.64 1.43 1.92 1.30 194 2.17 023 2.10 0.07 SHORT-TERM LIQUIDITY RATIOS Current Ratio Current assets/current liables Quick Ratio quidssets/currenties Operating Cash Flow Ratio cash fow tom operators /current abies 0.39 044 062 050 0.65 0.73 00 0.80 -0.07 0.69 0.42 0.01 0.24 0.40 0.40 0.00 NIA NIA 71.18 7725 7434 7382 7541 118.00 42.60 NIA NA 5.12 4.73 491 494 484 3.09 -1.74 14.10 -11.01 ACTIVITY RATIOS Receivables Tumover net les retending receivables Days Outstanding in Accounts Receivable 365 days I receivables turnover Inventory Tumover cost of sales/invertory Days of twentory on Hand 35/(cost of svertory) 3.43 427 448 447 4.99 3.87 -1.12 620 -233 10641 1551 8140 $1.72 6922 94.99 26.78 58.70 3629 44 96% 44919 44.49% 22 51% 42.4996 42.90% 1419 30 5.10 234% 3.61% 36496 23736 2004 4.269 1 24% 330 0.96% PROFITABILITY / PERFORMANCE RATION: Gross Profit Percentage gross proftness Profit Margin net income ness Return on Assets not income Retum on Equity income Ownerseguity 1600% 614% 100% 6.3% 409% 11.174 703% 740% 2.77% 21.00 12.10% 1622711009 6.14% 16,70% 11.56% 17 504 0.10% 079 O. 0.61 051 50 -0.01 0.14 -034 COVERADE RATIOS Debt to Equity ben/Shareholders investment Times Interest Farned income response interest expert 26:31 26 41 23 10.10 5057 4031 NA NIA - Expected values are obtained by using the forecast function in Excel (using the row of data tom 2012 and 2016 no ceturn the expected vakue kr 2016) + houty Source: Dun & Bradstot (D68). The medan values of the nautty ratos are used for compartion purposes. For tidos no specialy ncluded on D88, ratos were calculated from average financial statement data provided NIR = not available or could not be calculated tom francial data Hete all the fields on Work Paper 5-2 indicated below. Additionally, EarthWear Common-Size Financial Statements have been ed to aid you in your decisions. Paper 5-2 EARTHWEAR CLOTHIERS Preliminary Analytical Procedures Summary of Ratio Analyses & Assessment of Financial Condition December 31, 2016 nments and Summary on your review of Work Paper 5.1, list one or two ratios in each of the following categories that you believe increase the risk of tlal misstatement. Explain why you believe the risk is increased and identify possible causes of a potential misstatement and te if you believe the auditor would need to revise his or her typical audit approach to address the risk sample, "Days of Inventory on Hand" increased significantly indicating merchandise is held in Inventory for a longer period thon ears and it is also held for a longer period than the industry average. This increases the risk of obsolete inventory and/or the * value dropping below recorded cost. The auditor should increase the extent of inventory valuation testing and/or change the of the testing to address the increased risk. T-TERM LIQUIDITY RATIOS: 'ITY RATIOS: O This qu Required information nature of the testing to address the increased risk. SHORT-TERM LIQUIDITY RATIOS: ACTIVITY RATIOS: PROFITABILITY / PERFORMANCE RATIOS: COVERAGE RATIOS: 2. Assessment of Financial Position 2. Assessment of Financial Position Based on your review of Work Paper 5-4, assess the client's ability to continue as a going concern to stay in business) by responding to the following questions A. Identify ratios and trends. If any that cause concern about the clients ability to continue as a going concern B. Identity ratios and trends, if any, that indicate a high kelihood that the client will continue successfully as a going concem C Assess the client's financial condition as one of the following: D. Briefly explain the reasoning behind your assessment Required Information In this mini-case you will complete the preliminary analytical procedures for the 2016 audit of EarthWear Clothiers. Inc EARTHWEAR CLOTHIERS Commons Consolidated Balance Sheet | in Dousands 54 10/2017 December 31 2014 DollarValue SofTool Assets 2015 Dollar Value of Total Assets Expected DollarValue NoTotal Assets 2015 Actual DollarValue NoTool Ass Difference Dote Value NoTotal Asset 549 568 $11,590 3105.425 $10.772 $3.780 55.000 S18115 1679% 38% 35 55% 353% 127 234% 63407 548.978 $12.875 $122.337 $11.458 $5,315 $74132 5200095 1481 30% 3708% 3.47 $48282 514211 $139.249 512143 S40 $7,335 S230.675 13.29% 3915 30323 3 2444 2024 6331 579.350 $8.54) $147,693 $10.212 $5,430 $10.338 5261.680 20,38% 2.321 37939 2.62% 1.405 265% 57.2013 $31.071 $5568) 58.444 51,032 (53.454 $3000 $31504 1915 210 Assets Current Assets Cash and cash equivalents Receivables.net Inventory Prepaid advertising Other prepaid expenses Delenred income tax benefits Totalcuments Property, plant and equipment at cost Land and buiding Fitures and equipment Computer hardware and software Les hold improvements Total property, plant and equipment Les coumised depreciation and emotion Property, plant and equipment net Intangibles et Total 568,804 586878 34701 200 1875 22.70% $200 70% -1895 0305 -072% 104% 0.64% 30% 0.00% OSON - 113 3344 -0.05% 5515 -125 42 0394 0.00% OBOX 22:53 22.55 1801% 090 6207 25725 335 021 100 ON $184040 576256 5107,784 3628 570918 567513 $84.990 $3.010 S205 426 3856 $120440 5423 $329.90 2149 20.40% 1970% 0.91% 6250 2000 0509 0199 100.00% $75,000 568150 $82.507 $3.125 5228,812 $96718 $133.097 $210 $380.00 576.50 568,632 575.400 $3,144 $223,737 197.722 $125,014 $1,734 $389.428 6297 28 30% 35.00 0.00 100005 51520 $482 (57.107 520 $5,075) $2.007 57082 $1515 52000 19.66% 1762 19.36% 0.31% 5745% 25.09% 32309 0.49% 100.00% Liabilities and shareholder's Investment Current liabilities: Lines of credit 2.57% $11011 3349 2.70% 3.50 514401 57521 510.610 $3822 120 1. BE Intangibles.net Total 5628 5295527 0215 100.00 $123 $320.00 019% 100 DO 5218 $300 OON 10000% $1.734 5589.423 0.49% 100006 51510 26.020 03 000 21.00% 18 $7621 548432 55. 115 528.440 574 $8006 $98.01 5520 257 16.30 172 9 0618 225 Liabilities and shareholder investment Current liabilities Lines of credit Accounts payable Reserveren Acord labies Accrued protsharing Incometes pale Tourensbites Deferred income taxes Shareholders investment Common stock 21,144 shares issued Donated capital Adonlading Deferred compensation Accumulated other comprehensive Income Rated wings Tremur tick 004.711 and 6,540 share it on mely To Sharing investment Total and rhodenwestment 511011 $82.500 55,860 $26.738 51532 30 3116290 19 3. 1894 178 8.10% 040 2009 352 287 514401 570507 36604 $250 $1.270 59051 510,510 154.136 56.100 530492 $3100 $15222 $120.617 58345 270 13.915 1.57% 783 OMON 4.17 3097 2.14% 0.35 2001 37001 35 $3.00 122.401) 1505 $5.50 S100 35711 1313 SM 120% 710 027 0.94% 045 127 801 1401 2009 $200 SO 5201 35.400 520700 000 010 $5.50 521 35.400 122.170 154 ON 165 620 002 110 S10311 ($150 517 120630 3120403 000 14 651 GON ON 90618 45 ON 10000 13.550 007 150% 610 000 TON 333 331701 2.000 120422 205 1261 55,400 12.715 0536 $2.173 11402 (313413 0467 3300428 0.07 1 404 6.80 0.01 ON 2009 34 HON 100 os 3.560 12000 523920 544157 549414 SID 10 2015 10 ON Door 741 ODON 0 4300 504 1206527 10000 Expected values webised by using the forecast function in Bolunghe tow of enton 2014 and 2016 boton he expected vier 2016 55 10/2017 EARTHWEAR CLOTHERS Common Statements of Operations foarte per te For the pended December 2015 Expected Do NOS Do Value Nora 10000 0454 10000 1043.000 100.00 2016 Actual 2014 Dollar of 100.00% De Sofa 23.1931 OOON LAT 190 Net Sales OSTS 4 PER 5 of Next > For the perod ended December 31 2016 2014 2018 Expected Actual Dance Dollar SoSan Dollar No Sai DollarVale SofSales Dobra Sofa Dotar Vale Net Saire Sofa 157815 1000W 05.454 100005 100.000 9000 1019.890 100.00% (23193 000N Coloses 02.739 55 IN SA380 579 $20.040 50.47% 572103 361 1473 -35 Gross Poll 48% 104.001 2515 123007 40 47737 13.90 2400 Selling and admin 334 904 2005 94011 380N 190.001 17 374100 36.67% (1981) Non sono colored 0532 01 OD ODON 0.00% 0 0.00 Income from operations 51.306 50% 10.720 420 co 73.867 T215 27.08 2.00 Other income 000% 000 0.00% 0 0006 Wherente pense 11.220 010 93 0.1% 37 or 270 -0.0 1140 3025 interest income 00 1450 Q 017 0106 020 0.10 20 000 Gainon solo 00% 000 000 0.00 000 Other (1.000 01 OSON 21 4.30 GON To become 1100 20201 10222 02 (140) IN 000 004 Income before income 40.560 STON 35757 2705 42.60 76184 27464 279 Income 1313 2108 12 10 15701 151 26650 2013 1014 1109 Netnom 31222 307 22 2.375 41.400 420 16602 Basi namninga perahan 1.15 141 Diluted earnings per har 150 110 148 0.10 DC Westware untanding 18:56 19,551 12.150 1996 Dluindwerge share outstanding 2005 12.74 10000 1940 Expeded in othened by any the recent tinchen in Excelsing the row of tatom 2011 and 2015 on the wedde 2010 Review the ratio anayses contained on Work Paper 5-4 You can read the Advanced Mouse Selected Financial Recoin Chapter of the text for a description of the ratio ou will be asked to provide further analyses of these iss you complete Work Paper 52 Work Paper 5.1 TAWAR CLOTHES Het VA WAY 2013 December 31 2012 2013 2014 2015 2015 2016 Actual (Audited) (Audited) (Audited) Audited) Expected fundid) Difference from Expected Industry Difference Average from 2016) 1.64 1.43 1.92 1.30 194 2.17 023 2.10 0.07 SHORT-TERM LIQUIDITY RATIOS Current Ratio Current assets/current liables Quick Ratio quidssets/currenties Operating Cash Flow Ratio cash fow tom operators /current abies 0.39 044 062 050 0.65 0.73 00 0.80 -0.07 0.69 0.42 0.01 0.24 0.40 0.40 0.00 NIA NIA 71.18 7725 7434 7382 7541 118.00 42.60 NIA NA 5.12 4.73 491 494 484 3.09 -1.74 14.10 -11.01 ACTIVITY RATIOS Receivables Tumover net les retending receivables Days Outstanding in Accounts Receivable 365 days I receivables turnover Inventory Tumover cost of sales/invertory Days of twentory on Hand 35/(cost of svertory) 3.43 427 448 447 4.99 3.87 -1.12 620 -233 10641 1551 8140 $1.72 6922 94.99 26.78 58.70 3629 44 96% 44919 44.49% 22 51% 42.4996 42.90% 1419 30 5.10 234% 3.61% 36496 23736 2004 4.269 1 24% 330 0.96% PROFITABILITY / PERFORMANCE RATION: Gross Profit Percentage gross proftness Profit Margin net income ness Return on Assets not income Retum on Equity income Ownerseguity 1600% 614% 100% 6.3% 409% 11.174 703% 740% 2.77% 21.00 12.10% 1622711009 6.14% 16,70% 11.56% 17 504 0.10% 079 O. 0.61 051 50 -0.01 0.14 -034 COVERADE RATIOS Debt to Equity ben/Shareholders investment Times Interest Farned income response interest expert 26:31 26 41 23 10.10 5057 4031 NA NIA - Expected values are obtained by using the forecast function in Excel (using the row of data tom 2012 and 2016 no ceturn the expected vakue kr 2016) + houty Source: Dun & Bradstot (D68). The medan values of the nautty ratos are used for compartion purposes. For tidos no specialy ncluded on D88, ratos were calculated from average financial statement data provided NIR = not available or could not be calculated tom francial data Hete all the fields on Work Paper 5-2 indicated below. Additionally, EarthWear Common-Size Financial Statements have been ed to aid you in your decisions. Paper 5-2 EARTHWEAR CLOTHIERS Preliminary Analytical Procedures Summary of Ratio Analyses & Assessment of Financial Condition December 31, 2016 nments and Summary on your review of Work Paper 5.1, list one or two ratios in each of the following categories that you believe increase the risk of tlal misstatement. Explain why you believe the risk is increased and identify possible causes of a potential misstatement and te if you believe the auditor would need to revise his or her typical audit approach to address the risk sample, "Days of Inventory on Hand" increased significantly indicating merchandise is held in Inventory for a longer period thon ears and it is also held for a longer period than the industry average. This increases the risk of obsolete inventory and/or the * value dropping below recorded cost. The auditor should increase the extent of inventory valuation testing and/or change the of the testing to address the increased risk. T-TERM LIQUIDITY RATIOS: 'ITY RATIOS: O This qu Required information nature of the testing to address the increased risk. SHORT-TERM LIQUIDITY RATIOS: ACTIVITY RATIOS: PROFITABILITY / PERFORMANCE RATIOS: COVERAGE RATIOS: 2. Assessment of Financial Position 2. Assessment of Financial Position Based on your review of Work Paper 5-4, assess the client's ability to continue as a going concern to stay in business) by responding to the following questions A. Identify ratios and trends. If any that cause concern about the clients ability to continue as a going concern B. Identity ratios and trends, if any, that indicate a high kelihood that the client will continue successfully as a going concem C Assess the client's financial condition as one of the following: D. Briefly explain the reasoning behind your assessmentStep by Step Solution
There are 3 Steps involved in it
Step: 1

Get Instant Access to Expert-Tailored Solutions
See step-by-step solutions with expert insights and AI powered tools for academic success
Step: 2

Step: 3
Ace Your Homework with AI
Get the answers you need in no time with our AI-driven, step-by-step assistance
Get Started
Fundamentals Of Accounting Course 2
Authors: Claudia B. Gilbertson
9th Edition
053844827X, 9780538448277