

Answered step by step
Verified Expert Solution
Question
1 Approved Answer
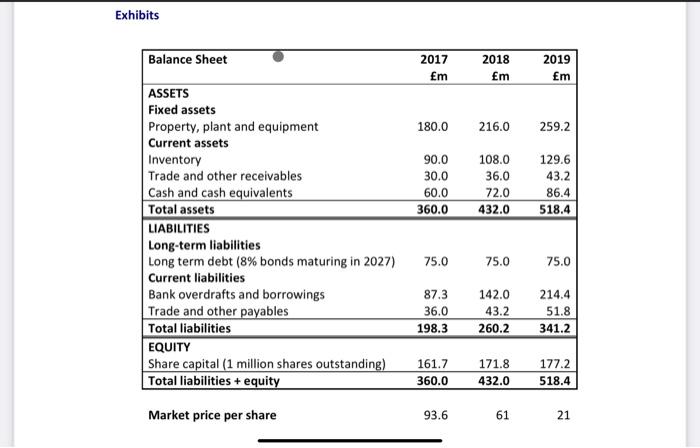
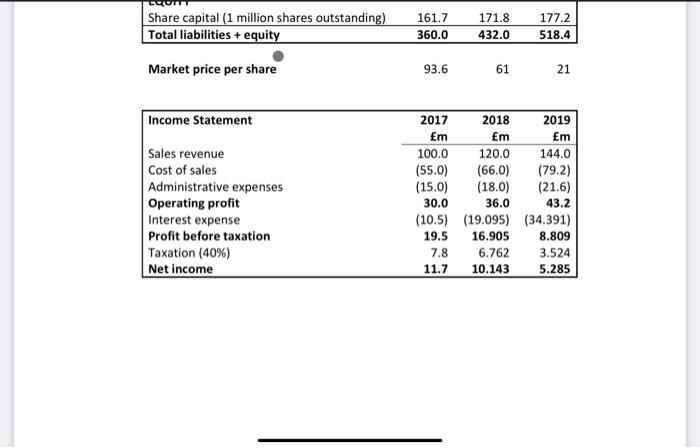
1. Calculate EVERGREEN CORP.s annual growth rate for sales, assets and operating profit in 2018 and 2019. What are the underlying drivers of these growth
1. Calculate EVERGREEN CORP.s annual growth rate for sales, assets and operating profit in 2018 and 2019. What are the underlying drivers of these growth rates?
2. Calculate EVERGREEN CORP.s financial ratios for 2018 and 2019, including a full Du Pont analysis.
3. Calculate EVERGREEN CORP.s Z-score for 2018 and 2019.
4. Based on your calculations, what are EVERGREEN CORP.s key strengths and weaknesses?
5. What recommendations would you make to the management of EVERGREEN CORP. to improve its performance? (be specific and make use of all the data available)
Step by Step Solution
There are 3 Steps involved in it
Step: 1

Get Instant Access to Expert-Tailored Solutions
See step-by-step solutions with expert insights and AI powered tools for academic success
Step: 2

Step: 3
Ace Your Homework with AI
Get the answers you need in no time with our AI-driven, step-by-step assistance
Get Started
Better Than Alpha Three Steps To Capturing Excess Returns In A Changing World
Authors: Christopher M. Schelling
1st Edition
1264257651,126425766X