

Question
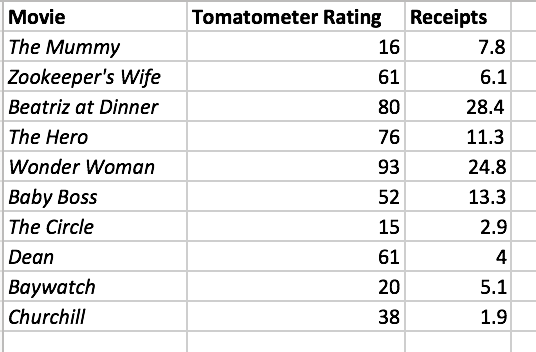
1. Can you use movie critics' opinions to forecast box office receipts on the opening weekend? The data stored in Tomatometer.xlsx (attached pic) include the
1. Can you use movie critics' opinions to forecast box office receipts on the opening weekend? The data stored in Tomatometer.xlsx (attached pic) include the Tomatometer rating, the percentage of professional critic reviews that are positive, and the receipts per theater ($thousands) on the weekend a movie opened for ten movies.
a. Use the least-squares method to get the regression coefficients b(lower power 0)and b(lower power 1). Interpret the meaning of b(lower power 0)and b(lower power 1)in this problem.
b. Predict the mean receipts for a movie that has a Tomatometer rating of 55%.
c. Determine the coefficient of determination, r^2, and explain its meaning in this problem.
d. Perform a residual analysis by plotting residuals against X and constructing the normal probability plot of residuals. Is there any evidence of a pattern in the residuals? Explain.
e. At the 0.05 level of significance, is there evidence of a linear relationship between Tomatometer rating and receipts? Explain.
f.Based on the results of part (a)-(e), do you think that Tomatometer rating is a useful predictor of receipts on the first weekend a movie opens? Explain.
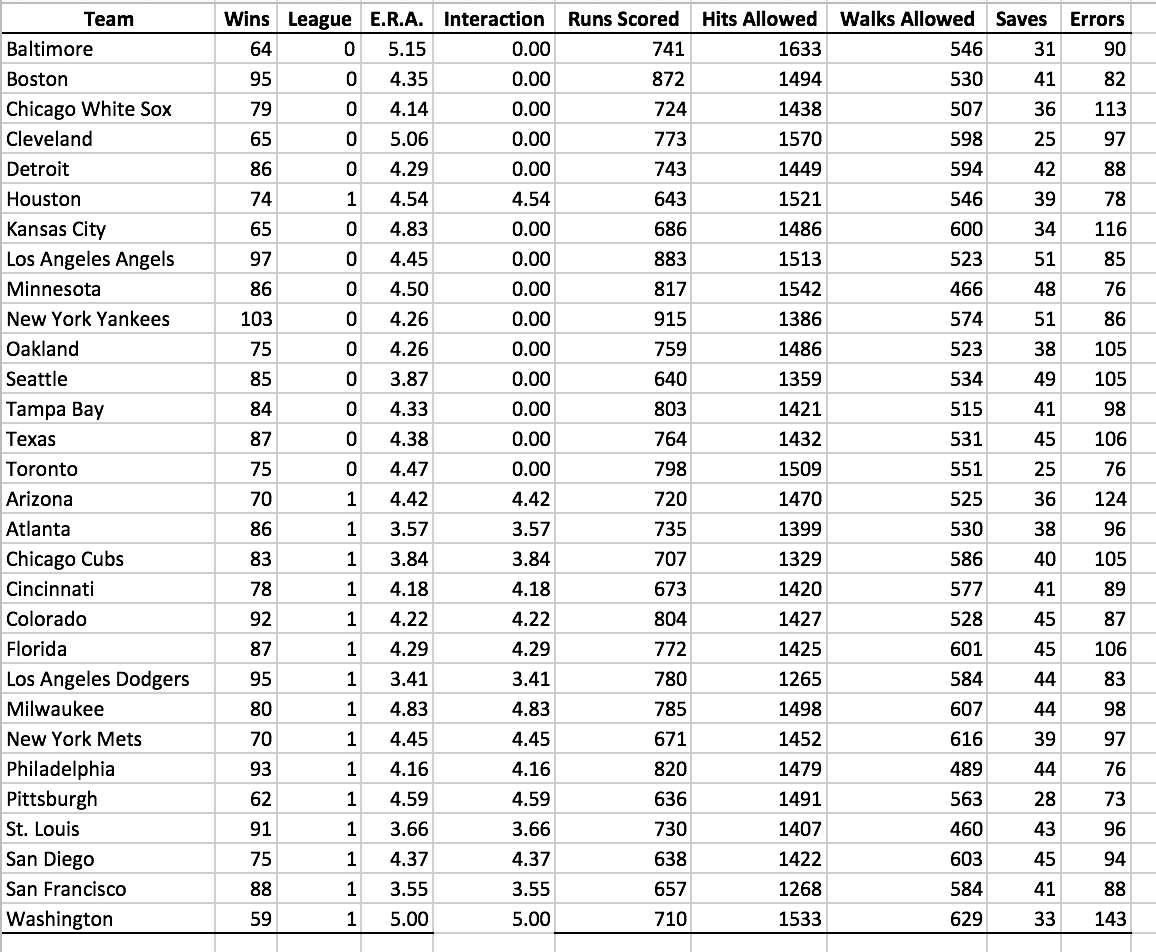
2. A baseball analytics specialist wants to determine which variables are important in predicting a team's wins in a given season. He has collected data related to wins, earned run average (ERA), and runs scored per game for a recent season (stored in Baseball.xlsx) (attached pic). Develop a model to predict the number of wins based on ERA and runs scored per game.
a. State the multiple regression equation and interpret the meaning of the slopes in this equation.
b. Is there a significant relationship between the number of wins and the two independent variables (ERA and runs scored per game) at the 0.05 level of significance? Explain.
c. At the 0.05 level of significance, determine whether each independent variable makes a significant contribution to the regression model. Explain.
d. Construct a 95% confidence interval estimate of the population slope between wins and ERA.
Suppose the analytics specialist decides to drop runs scored per game and to include the league (0 = American, 1 = National) as an independent variable in addition to ERA. Develop a model to predict wins based on ERA and league. For (e) through (g), DO NOT include an interaction term.
e. State the multiple regression equation and interpret the meaning of the slopes in this equation.
f. Is there a significant relationship between the number of wins and the two independent variables (ERA and league) at the 0.05 level of significance? Explain.
g. At the 0.05 level of significance, determine whether each independent variable makes a significant contribution to the regression model. Explain.
h. Add an interaction term to the model and at the 0.05 level of significance, determine whether it makes a significant contribution to the model.
Step by Step Solution
There are 3 Steps involved in it
Step: 1

Get Instant Access to Expert-Tailored Solutions
See step-by-step solutions with expert insights and AI powered tools for academic success
Step: 2

Step: 3
Ace Your Homework with AI
Get the answers you need in no time with our AI-driven, step-by-step assistance
Get Started
Public Relations
Authors: Tom Kelleher
1st Edition
0190201479, 9780190201470