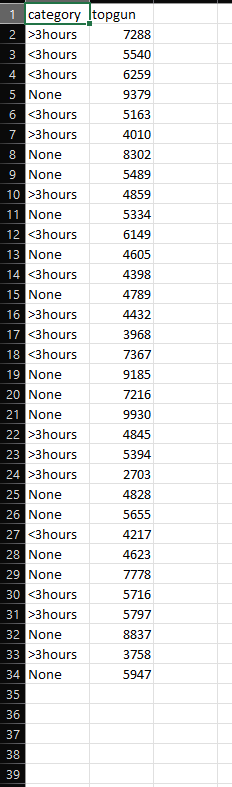
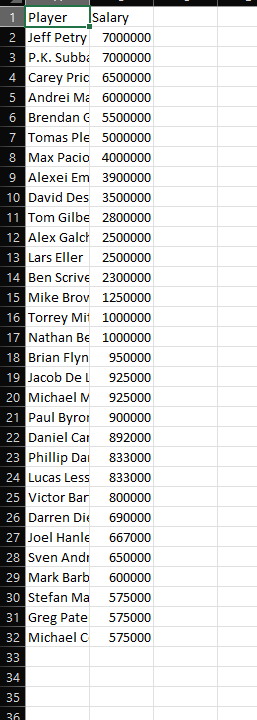
1 category topgun 1 Player Salary 2 Jeff Petry 7000000 3 P.K. Subbi 7000000 Carey Pric 6500000 Andrei M 6000000 Brendan e 5500000 Tomas Ple 5000000 8 Max Pacio 4000000 9 Alexei Em 3900000 10 David Des 3500000 11 Tom Gilbe 2800000 12 Alex Galcr 2500000 13 Lars Eller 2500000 14 Ben Scrive 2300000 15 Mike Brov 1250000 16 Torrey Mit 1000000 17 Nathan Be 1000000 18 Brian Flyn 950000 19 Jacob De L 925000 20 Michael N 925000 21 Paul Byror 900000 22 Daniel Car 892000 23 Phillip Da 833000 24 Lucas Less 833000 25 Victor Bar 800000 26 Darren Di 690000 27 Joel Hanle 667000 28 Sven Andi 650000 29 Mark Barb 600000 30 Stefan Ma 575000 31 Greg Pate 575000 32 Michael C 575000 Directions: The purpose of this lab is to introduce you to analyzing and writing about data. For each data set, analyze the data in Jamovi, copy and paste the results from the analysis into this document, then write about the results - what are your observations? For each dataset you analyze, you should: - Identify the individuals and variables, along with the type of variable for each variable in the dataset. - If the variable is categorical: create both a pie chart and a bar chart for the data. - If the variable is quantitative: find the five number summary, the mean, the standard deviation, create a boxplot, and histogram Determine if there are any outliers in the data (use the output from the five number summary to calculate the 1.5IQR rule) - Once you have created appropriate graphs/charts for each variable in the dataset, then you need to write about your observations. Your observations should be a small paragraph, with full sentences and proper punctuation etc. To write your observations, look at all the graphs and see what they tell you about the data. Look at shape, center, spread to begin (if quantitative data). Write about any general observations or characteristics that stand out to you (like outliers or trends/patterns that you see). What do the graphs and charts say about the data? 1) Hockey Salary Data: (ex02-44hockey.xls) The Montreal Canadians are the longest continuously operating professional ice hockey team. The dataset provides the salaries of the 2013-14 roster. Provide the team owner with a full description of the distribution of salaries and a brief summary of its most important features. Things to consider: Which player(s) the highest salary? Which have the lowest? What is the average salary of players on the team? Are any salaries considered an outlier? What is the shape, center, spread of the salaries and what does this tell you about the team? 2) Top Gun Surgical Data: (ex02-48topgun.xls) The Top Gun Laparoscopic Skills and Suturing Program was developed to help surgeons develop the skills set necessary for laparoscopic surgery. Because of the similarity between skills required for laparoscopic surgery and video gaming, it was hypothesized that prior gaming experience would acquire skills for laparoscopic surgery more easily. Thirty-three surgeons participated in this study and were classified into categories: never played, under three hours, and over three hours, depending on the number of hours they played video games at the height of their video game use. These surgeons then completed a simulation surgery Top Gun Drills and received a score based on their performance (lower scores indicate better performance - points were added for longer time spent and for errors made). Write about your observations. Some things to consider: Overall, how did the surgeons perform on the task? Does prior gaming experience assist in gaining skills for laparoscopic surgery? Why or why not? Which group(s) performed best? Worst