Answered step by step
Verified Expert Solution
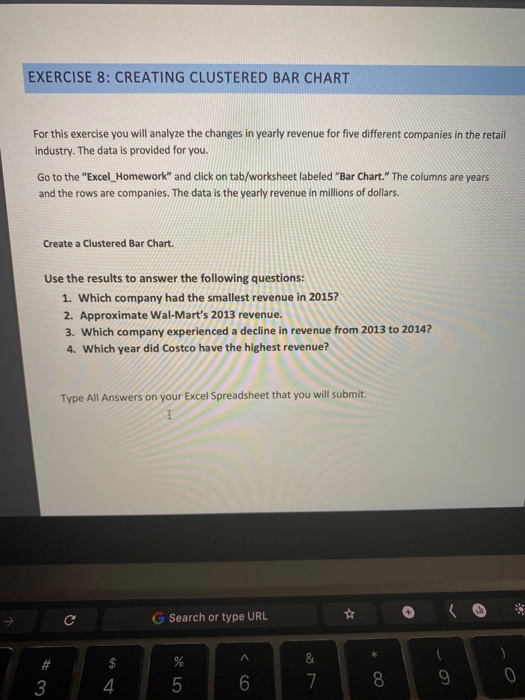
Link Copied!

Question

1 Approved Answer

1 Company 2 Wal-Mart 3 Costco 4 Sears 5 Dollar General 6 Target 7 2016 468,651.00 102,870.00 36,188.00 16,022.10 72,596.00 2015 446,509.00 97,062.00 39,854.00 14,807.20

image text in transcribed
1 Company 2 Wal-Mart 3 Costco 4 Sears 5 Dollar General 6 Target 7 2016 468,651.00 102,870.00 36,188.00 16,022.10 72,596.00 2015 446,509.00 97,062.00 39,854.00 14,807.20 73,301.00 2014 421,395.00 87,048.00 41,567.00 13,035.00 69,865.00 2013 407,697.00 76,255.00 42,664.00 11,796.00 67,390.00 EXERCISE 8: CREATING CLUSTERED BAR CHART For this exercise you will analyze the changes in yearly revenue for five different companies in the retail industry. The data is provided for you. Go to the "Excel_Homework" and click on tab/worksheet labeled "Bar Chart." The columns are years and the rows are companies. The data is the yearly revenue in millions of dollars. Create a Clustered Bar Chart Use the results to answer the following questions: 1. Which company had the smallest revenue in 2015? 2. Approximate Wal-Mart's 2013 revenue. 3. Which company experienced a decline in revenue from 2013 to 2014? 4. Which year did Costco have the highest revenue? Type All Answers on your Excel Spreadsheet that you will submit G Search or type URL A & 3 4. 9 0 5 6 7 8

Step by Step Solution

There are 3 Steps involved in it

Step: 1

blur-text-image

Get Instant Access to Expert-Tailored Solutions

See step-by-step solutions with expert insights and AI powered tools for academic success

Step: 2

blur-text-image

Step: 3

blur-text-image

Ace Your Homework with AI

Get the answers you need in no time with our AI-driven, step-by-step assistance

Get Started

Recommended Textbook for

Auditing Markets Products And Marketing

Authors: David Parmerlee

1st Edition

0658001337, 978-0658001338

More Books

Students also viewed these Accounting questions