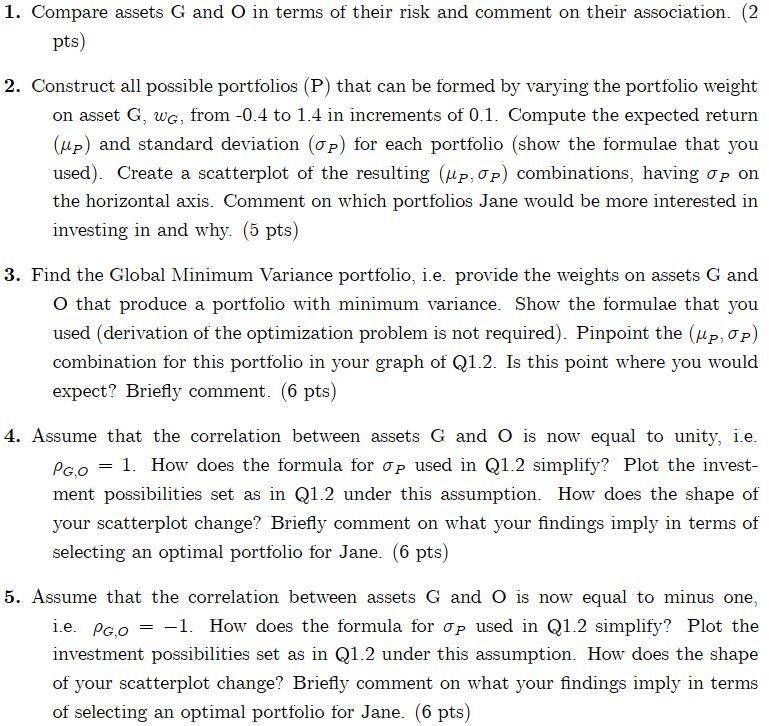
1. Compare assets G and O in terms of their risk and comment on their association. (2 pts) 2. Construct all possible portfolios (P) that can be formed by varying the portfolio weight on asset G, WG, from -0.4 to 1.4 in increments of 0.1. Compute the expected return (up) and standard deviation (op) for each portfolio (show the formulae that you used). Create a scatterplot of the resulting (up. 0p) combinations, having op on the horizontal axis. Comment on which portfolios Jane would be more interested in investing in and why. (5 pts) 3. Find the Global Minimum Variance portfolio, i.e. provide the weights on assets G and O that produce a portfolio with minimum variance. Show the formulae that you used (derivation of the optimization problem is not required). Pinpoint the (pp, 0p) combination for this portfolio in your graph of Q1.2. Is this point where you would expect? Briefly comment. (6 pts) = PGO 4. Assume that the correlation between assets G and O is now equal to unity, i.e. 1. How does the formula for Op used in Q1.2 simplify? Plot the invest- ment possibilities set as in Q1.2 under this assumption. How does the shape of your scatterplot change? Briefly comment on what your findings imply in terms of selecting an optimal portfolio for Jane. (6 pts) 5. Assume that the correlation between assets G and O is now equal to minus one, i.e. PGO = -1. How does the formula for Op used in Q1.2 simplify? Plot the investment possibilities set as in Q1.2 under this assumption. How does the shape of your scatterplot change? Briefly comment on what your findings imply in terms of selecting an optimal portfolio for Jane. (6 pts) 1. Compare assets G and O in terms of their risk and comment on their association. (2 pts) 2. Construct all possible portfolios (P) that can be formed by varying the portfolio weight on asset G, WG, from -0.4 to 1.4 in increments of 0.1. Compute the expected return (up) and standard deviation (op) for each portfolio (show the formulae that you used). Create a scatterplot of the resulting (up. 0p) combinations, having op on the horizontal axis. Comment on which portfolios Jane would be more interested in investing in and why. (5 pts) 3. Find the Global Minimum Variance portfolio, i.e. provide the weights on assets G and O that produce a portfolio with minimum variance. Show the formulae that you used (derivation of the optimization problem is not required). Pinpoint the (pp, 0p) combination for this portfolio in your graph of Q1.2. Is this point where you would expect? Briefly comment. (6 pts) = PGO 4. Assume that the correlation between assets G and O is now equal to unity, i.e. 1. How does the formula for Op used in Q1.2 simplify? Plot the invest- ment possibilities set as in Q1.2 under this assumption. How does the shape of your scatterplot change? Briefly comment on what your findings imply in terms of selecting an optimal portfolio for Jane. (6 pts) 5. Assume that the correlation between assets G and O is now equal to minus one, i.e. PGO = -1. How does the formula for Op used in Q1.2 simplify? Plot the investment possibilities set as in Q1.2 under this assumption. How does the shape of your scatterplot change? Briefly comment on what your findings imply in terms of selecting an optimal portfolio for Jane. (6 pts)