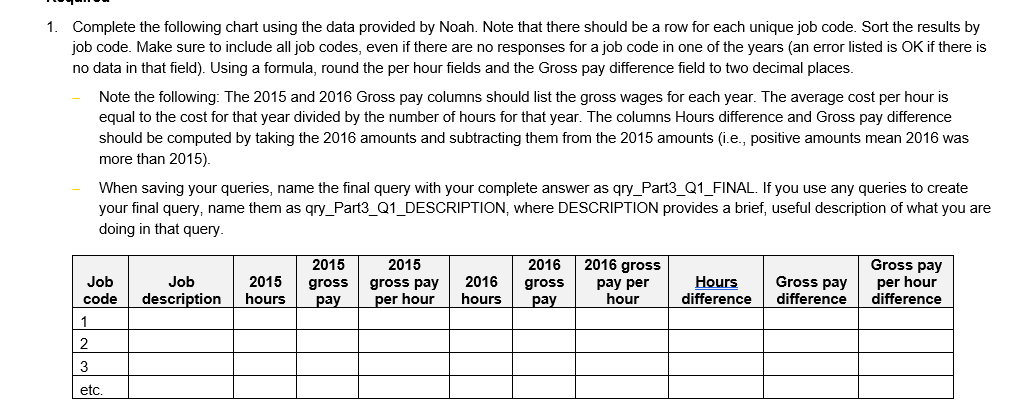
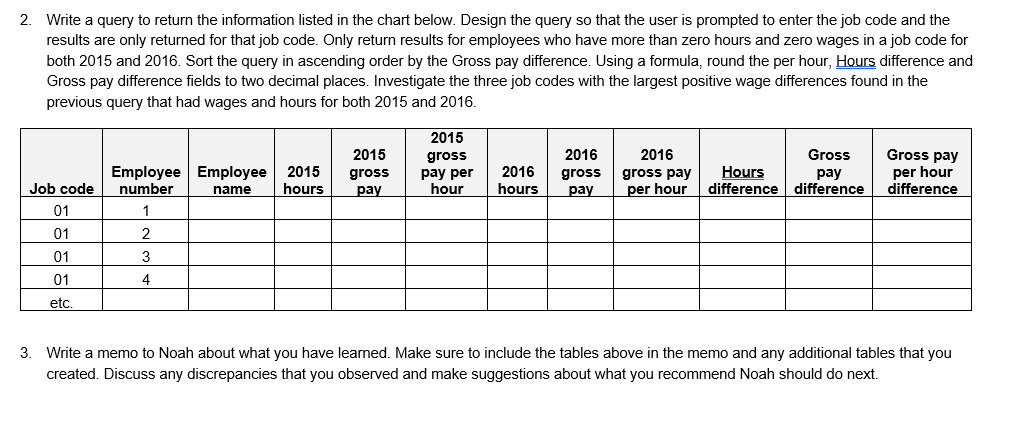
1. Complete the following chart using the data provided by Noah. Note that there should be a row for each unique job code. Sort the results by job code. Make sure to include all job codes, even if there are no responses for a job code in one of the years (an error listed is OK if there is no data in that field). Using a formula, round the per hour fields and the Gross pay difference field to two decimal places. Note the following: The 2015 and 2016 Gross pay columns should list the gross wages for each year. The average cost per hour is equal to the cost for that year divided by the number of hours for that year. The columns Hours difference and Gross pay difference should be computed by taking the 2016 amounts and subtracting them from the 2015 amounts (i.e., positive amounts mean 2016 was more than 2015) When saving your queries, name the final query with your complete answer as gry_Part3_Q1_FINAL. If you use any queries to create your final query, name them as qry_Part3_Q1_DESCRIPTION, where DESCRIPTION provides a brief, useful description of what you are doing in that query 2016 2016 gross Job code Job description Gross pay 2015 gross pay 2015 hours 2015 gross pay 2016 hours gross pay pay per hour Hours difference Gross pay per hour difference per hour difference 1 2 3 etc 2. Write a query to return the information listed in the chart below. Design the query so that the user is prompted to enter the job code and the results are only returned for that job code. Only return results for employees who have more than zero hours and zero wages in a job code for both 2015 and 2016. Sort the query in ascending order by the Gross pay difference. Using a formula, round the per hour, Hours difference and Gross pay difference fields to two decimal places. Investigate the three job codes with the largest positive wage differences found in the previous query that had wages and hours for both 2015 and 2016. 2015 Gross pay 2015 hours 2015 gross pay gross pay per hour 2016 hours 2016 gross pay 2016 gross pay per hour Gross Hours pay difference difference per hour difference Job code 01 01 01 01 Employee Employee number name 1 2 3 4 etc. 3. Write a memo to Noah about what you have learned. Make sure to include the tables above in the memo and any additional tables that you created. Discuss any discrepancies that you observed and make suggestions about what you recommend Noah should do next. 1. Complete the following chart using the data provided by Noah. Note that there should be a row for each unique job code. Sort the results by job code. Make sure to include all job codes, even if there are no responses for a job code in one of the years (an error listed is OK if there is no data in that field). Using a formula, round the per hour fields and the Gross pay difference field to two decimal places. Note the following: The 2015 and 2016 Gross pay columns should list the gross wages for each year. The average cost per hour is equal to the cost for that year divided by the number of hours for that year. The columns Hours difference and Gross pay difference should be computed by taking the 2016 amounts and subtracting them from the 2015 amounts (i.e., positive amounts mean 2016 was more than 2015) When saving your queries, name the final query with your complete answer as gry_Part3_Q1_FINAL. If you use any queries to create your final query, name them as qry_Part3_Q1_DESCRIPTION, where DESCRIPTION provides a brief, useful description of what you are doing in that query 2016 2016 gross Job code Job description Gross pay 2015 gross pay 2015 hours 2015 gross pay 2016 hours gross pay pay per hour Hours difference Gross pay per hour difference per hour difference 1 2 3 etc 2. Write a query to return the information listed in the chart below. Design the query so that the user is prompted to enter the job code and the results are only returned for that job code. Only return results for employees who have more than zero hours and zero wages in a job code for both 2015 and 2016. Sort the query in ascending order by the Gross pay difference. Using a formula, round the per hour, Hours difference and Gross pay difference fields to two decimal places. Investigate the three job codes with the largest positive wage differences found in the previous query that had wages and hours for both 2015 and 2016. 2015 Gross pay 2015 hours 2015 gross pay gross pay per hour 2016 hours 2016 gross pay 2016 gross pay per hour Gross Hours pay difference difference per hour difference Job code 01 01 01 01 Employee Employee number name 1 2 3 4 etc. 3. Write a memo to Noah about what you have learned. Make sure to include the tables above in the memo and any additional tables that you created. Discuss any discrepancies that you observed and make suggestions about what you recommend Noah should do next