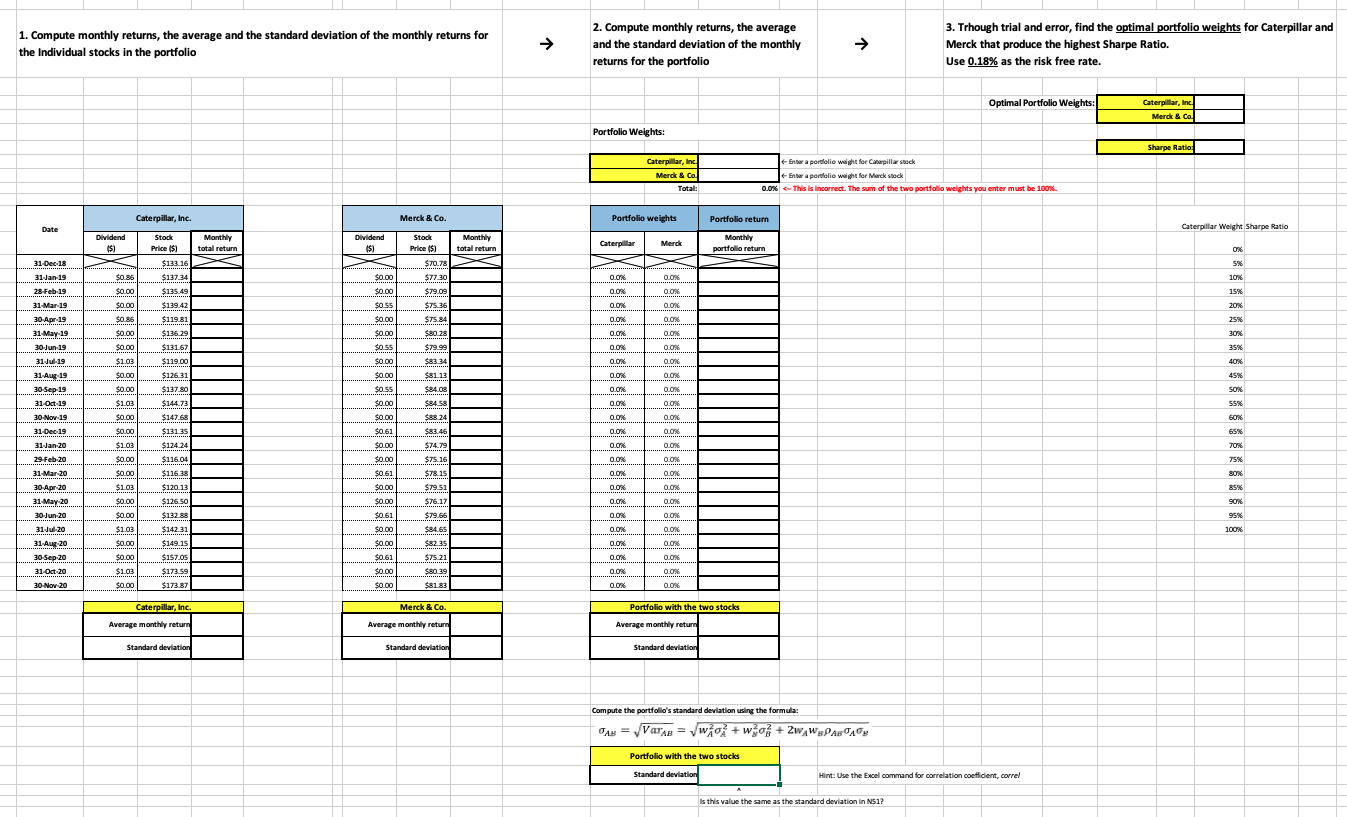
1. Compute monthly returns, the average and the standard deviation of the monthly returns for the Individual stocks in the portfolio 2. Compute monthly returns, the average and the standard deviation of the monthly returns for the portfolio 3. Trhough trial and error, find the optimal portfolio weights for Caterpillar and Merck that produce the highest Sharpe Ratio. Use 0.18% as the risk free rate. Optimal Portfolio Weights: Caterpillar, Inc Merck & Co Portfolio Weights: Sharpe Ratio: Caterpillar, Inc Merck & Co Total: Enter a pordolie weight for Caterpillar stock Enara portalio weight for Merck stock 0.0% This is incorrect. The sum of the two portfolio weights you enter must be 100% Caterpillar, Inc Merck & Co. Portfolio weights Portfolio return Date Caterpillar Weight Sharpe Ratio Dividend $ ($) Monthly total return Stock Price $1 $133.16 Dividend 191 Caterpillar Merck Monthly portfolio return 0% 31-Dec 12 Stock Monthly Price $1 total return $70.78) $ $7730 $79.09 ******** 5% 10% 31 Jan 15 $0.86 $137.34 0.0% 0.0% $0.00 $0.00 28-Feb-19 $0.00 0.0 OOK 15% $135.49 $139.42 $0.00 $0.55 $75.36 0.0% 0.0% 20% 31 Mar 19 30 Apr 19 $119.81 $0.00 $75.84 % 0.0% 0.0% 25% $0.86 $0.00 31-May-19 $116.29 $0.00 $80.28 0.0% 0.0 30% $0.00 $13167 SO 55 0.00 0.0% 35% $79.991 $83 34 $1.03 $0.00 0.0% 0.0% 40% 30 Jun-19 31-Jul-19 31 Auris 30-Sep-19 $119.00 $126.31 $0.00 $0.00 $81 13 0.0% O ON 45% $137.80 $0.55 $84.08 00 con 50% $0.00 $1.03 erleri 31-Oct-19 0.0 0.0% 55% $144.73 $147.68 $0.00 $0.00 $84.58 $88.24 $0.00 0.0% 0.0% 60% 30 Nov 19 31-Dec 19 31 Jan 20 0.0% 0.0% 65% $0.00 $1.03 $13135 ..RSRSREBBE $124 24 $0.61 $0.00 $83.46 ......... $74.79 0.0% 70% % 0.0% OOK 29 Feb 20 $0.00 $116.04 $0.00 0.0% % 75% 80% 31-Mar-20 $0.00 0.0% 0.0 $116.38 $120.13 $0.61 $0.00 $1.03 0.0% 0.0% 85% % $75.16 ******** $78.15 $79.51 $76.17 ********** $79.66 $84.65 $0.00 $126.50 $0.00 0.0% 00 30-Apr-20 31 May 20 30 Jun 20 31 Jul 20 90% $0.00 $112.88 $0.61 00 O ON 95% 100% $1.03 $142 31 $0.00 00 On $0.00 $0.00 $225 0.0% 0.0% $0.00 $0.61 $149.15 $157.05 ********** $173.59 0.0% 31-Aug-20 30-Sep 20 31-Oct-20 30-Nov-20 0.0% $1.03 $0.00 $75.21 $80 39 $8183 0.0% 0.0% $0.00 $173.87 $ $0.00 Ook Ook Merck & Co. Portfolio with the two stocks Caterpillar, Inc. Average monthly return Average monthly return Average monthly return Standard deviation Standard deviation Standard deviation Compute the portfolio's standard deviation using the formula: JAH = Varas = /wo+wo+ 2wW PAOLO Portfolio with the two stocks Standard deviation Hint: Use the Excel command for correlation coefficient, correl Is this value the same as the standard deviation in N51? 1. Compute monthly returns, the average and the standard deviation of the monthly returns for the Individual stocks in the portfolio 2. Compute monthly returns, the average and the standard deviation of the monthly returns for the portfolio 3. Trhough trial and error, find the optimal portfolio weights for Caterpillar and Merck that produce the highest Sharpe Ratio. Use 0.18% as the risk free rate. Optimal Portfolio Weights: Caterpillar, Inc Merck & Co Portfolio Weights: Sharpe Ratio: Caterpillar, Inc Merck & Co Total: Enter a pordolie weight for Caterpillar stock Enara portalio weight for Merck stock 0.0% This is incorrect. The sum of the two portfolio weights you enter must be 100% Caterpillar, Inc Merck & Co. Portfolio weights Portfolio return Date Caterpillar Weight Sharpe Ratio Dividend $ ($) Monthly total return Stock Price $1 $133.16 Dividend 191 Caterpillar Merck Monthly portfolio return 0% 31-Dec 12 Stock Monthly Price $1 total return $70.78) $ $7730 $79.09 ******** 5% 10% 31 Jan 15 $0.86 $137.34 0.0% 0.0% $0.00 $0.00 28-Feb-19 $0.00 0.0 OOK 15% $135.49 $139.42 $0.00 $0.55 $75.36 0.0% 0.0% 20% 31 Mar 19 30 Apr 19 $119.81 $0.00 $75.84 % 0.0% 0.0% 25% $0.86 $0.00 31-May-19 $116.29 $0.00 $80.28 0.0% 0.0 30% $0.00 $13167 SO 55 0.00 0.0% 35% $79.991 $83 34 $1.03 $0.00 0.0% 0.0% 40% 30 Jun-19 31-Jul-19 31 Auris 30-Sep-19 $119.00 $126.31 $0.00 $0.00 $81 13 0.0% O ON 45% $137.80 $0.55 $84.08 00 con 50% $0.00 $1.03 erleri 31-Oct-19 0.0 0.0% 55% $144.73 $147.68 $0.00 $0.00 $84.58 $88.24 $0.00 0.0% 0.0% 60% 30 Nov 19 31-Dec 19 31 Jan 20 0.0% 0.0% 65% $0.00 $1.03 $13135 ..RSRSREBBE $124 24 $0.61 $0.00 $83.46 ......... $74.79 0.0% 70% % 0.0% OOK 29 Feb 20 $0.00 $116.04 $0.00 0.0% % 75% 80% 31-Mar-20 $0.00 0.0% 0.0 $116.38 $120.13 $0.61 $0.00 $1.03 0.0% 0.0% 85% % $75.16 ******** $78.15 $79.51 $76.17 ********** $79.66 $84.65 $0.00 $126.50 $0.00 0.0% 00 30-Apr-20 31 May 20 30 Jun 20 31 Jul 20 90% $0.00 $112.88 $0.61 00 O ON 95% 100% $1.03 $142 31 $0.00 00 On $0.00 $0.00 $225 0.0% 0.0% $0.00 $0.61 $149.15 $157.05 ********** $173.59 0.0% 31-Aug-20 30-Sep 20 31-Oct-20 30-Nov-20 0.0% $1.03 $0.00 $75.21 $80 39 $8183 0.0% 0.0% $0.00 $173.87 $ $0.00 Ook Ook Merck & Co. Portfolio with the two stocks Caterpillar, Inc. Average monthly return Average monthly return Average monthly return Standard deviation Standard deviation Standard deviation Compute the portfolio's standard deviation using the formula: JAH = Varas = /wo+wo+ 2wW PAOLO Portfolio with the two stocks Standard deviation Hint: Use the Excel command for correlation coefficient, correl Is this value the same as the standard deviation in N51