

Answered step by step
Verified Expert Solution
Question
1 Approved Answer
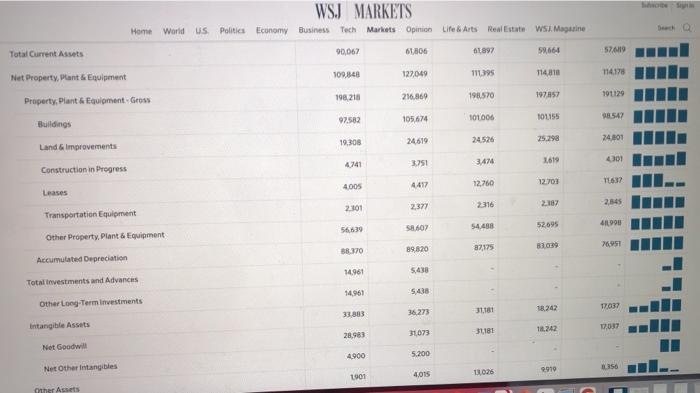
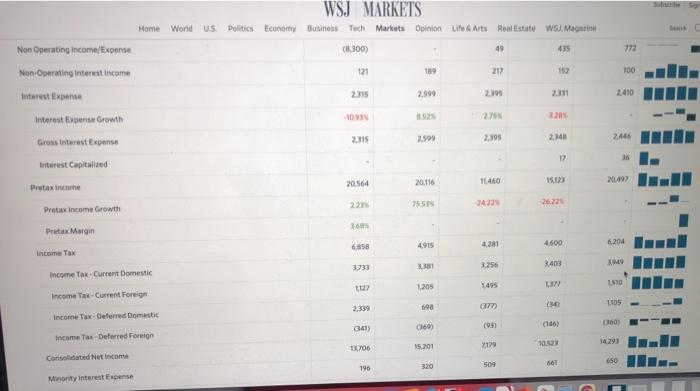
1) Conduct a horizontal analysis on any two items each from the balance sheet and the income statement. thus, you will have 4 items. comment
1) Conduct a horizontal analysis on any two items each from the balance sheet and the income statement. thus, you will have 4 items. comment on your results.
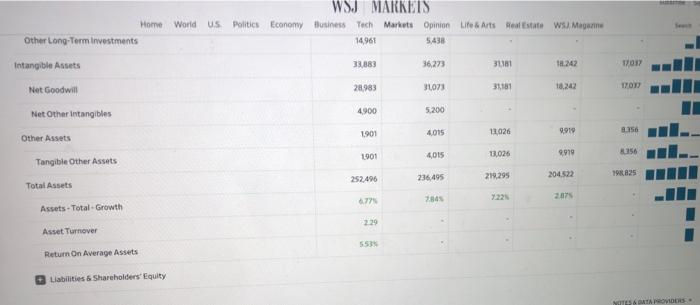
WSJ MARKETS World US Politics Economy Business Tech Markets Opinion Life & Arts Real Estate WSI. Magarine Home Assets 2021 2020 2019 2018 2012 Seartrend 17,741 9,465 7.756 6.756 1867 17,741 9,465 2.756 6,756 4.857 37401 22.03% 14.SON Fiscal year is February January. Alt values USD Million Cash & Short Term investments Cash Only Cash & Short Term Investments Growth Cash & ST Investments/Total Assets Total Accounts Receivable Accounts Receivables, Net Accounts Receivables, Gross 703 4.00% 3545 330% 1459 6,284 4203 5614 5.8.35 6.516 6.264 5614 5.85 6.516 6.284 6,283 5,614 5914 (79) Bad Debit/Doubtful Accounts 3.67 0.02% 1921 Accounts Receivable Growth 85.81 8330 09.05 33:14 Accounts Receivable Turnover 47 48046 44949 44.435 44209 inventories 44,99 61,046 44.435 44.269 Finished Goods 3509 1622 1511 1941 20,861 Other Current Assets 11 1941 20,867 1622 2.500 Miscellaneous Current Assets WSJ MARKETS Business Tech Markets Opinion Life & Arts Real Estate WSI. Magazine Home World Us Politics Economy 90,067 61,506 1897 Total Current Assets 59,664 57/4119 109.848 127,049 11.19 Net Property, Plant & Equipment 114,010 114178 198,218 216,869 1970 197,857 101129 Property. Plant & Equipment Gross Buildings 97.582 105674 101006 100155 98.547 19.308 24.619 24.526 25298 24.01 Land improvements 3.251 3.474 2619 4741 4301 Construction in Progress 12.760 12.703 4005 4417 Leases 2.377 2.301 2316 2.107 Transportation Equipment 52695 61998 56,639 58.607 5448 Other Property, Plant & Equipment 76951 89,820 82175 81039 8.370 Accumulated Depreciation 14.961 5.438 Total investments and Advances 14,961 5:43 Other Long-Term Investments 18,242 17,037 33.883 36.273 31,181 Intangible Assets 103 28.983 1.242 31073 3181 Net Goodwill 4900 5.200 Net Other intangibles 9910 S6 4,015 1026 Other Assets WSJ MARKETS World US Politics Economy Business Tech Markets Opinion Life & Arts Real Estate w Magazine 14961 33,883 36,273 31181 1.22 017 Home Other Long-Term Investments Intangible Arts Net Goodwin Net Other Intangibles 28.983 31073 31181 18.242 IYOT 4900 5.200 9919 1901 11026 156 4015 Other Assets 1901 13,026 9919 356 4,015 Tangible Other Assets Total Assets 252.496 236,495 219.295 198,825 204522 207 77 Assets - Total Growth Asset Turnover Return On Average Assets Liabilities & Shareholders' Equity NOTES SATAPOS WSJ MARKETS World US Politics Economy Business Tech Markets Opinion Life & Arts Real Estate WS) Magazine Hortve 2021 2020 2019 2018 2011 5-year trend 559151 523.964 514405 199.900 485,144 Flocal year is Pobrary January, All values USD Millions Sales/Revenue Sales Growth Cost of Goods Sold (COGS) Ind DLA COGS excluding DGA 2.909 304 420.315 394605 385.301 37.96 561255 409,163 383,618 374.623 362,857 17 10152 10.987 Depreciation & Amortization Expense 10,670 10529 10.080 10152 10.987 10.678 10.520 Depreciation 10000 241 119 COGS Growth 138,836 129.359 129 104 126,513 123898 Gross income 0204 2016 Gross income Growth Gross Profit Margin TOUS 111,388 107001 105 10 107.17 SGGA Expense 11.BH 102891 10716 105,310 Other SGSA 2.70 0.00 SGA Growth 21957 21458 20201 22.035 26.945 EBIT IS 4136 (4.1100 CLOS Un pense WSJ MARKETS World US Politics Economy Business Tech Markets Opinion Life & Arts Real Estate WSA Magazine Home Net Income 13.510 14881 6,670 9,662 3,640 9211 12105 2771 242 13.510 14.381 6670 9.362 160 12510 14.81 6,670 1562 TE Net Income Growth Net Margin Net Income After Extraordinaries Net Income Avintable to Common EPS (Basic EPS (Basic Growth Base Shares Outstanding EPS Colored) 475 519 226 120 1295 31104 2013 2831 2850 2.929 2,995 2101 4.75 5.19 2.30 120 EPS (Diluted) Growth 2545 129.00 30 Diluted Shares Outstanding 2,847 2,868 2.945 2010 X112 38,100 EBITDA 32435 31732 12,115 EBITDA Growth 17.305 285 19 6.89 EBITDA Margin 26.94 ESIT 21468 21957 2020 22.035 2) Conduct a vertical analysis on any two items from the Balance sheet and Income statement. That is you will have a total of 4 items. You cannot count the base account as one of the items. Comment on your results.
walmart's balance sheet 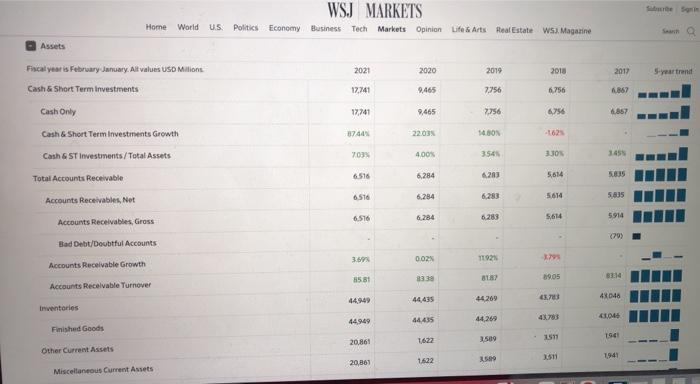
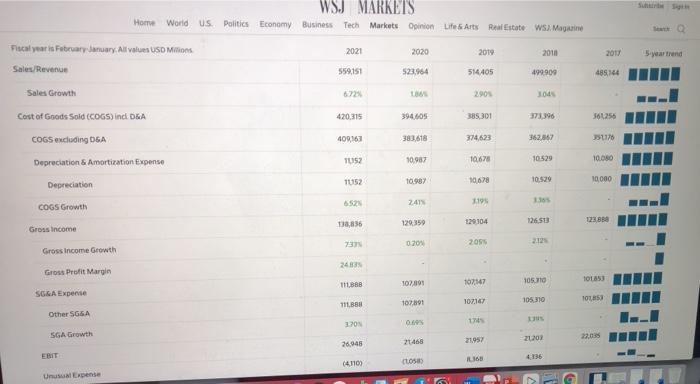
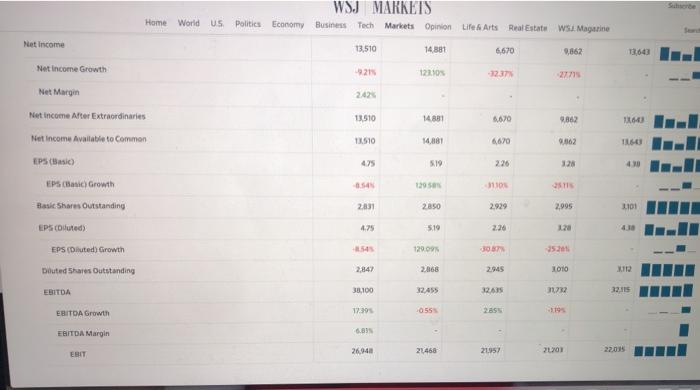
Walmart's Annual Income
Step by Step Solution
There are 3 Steps involved in it
Step: 1

Get Instant Access to Expert-Tailored Solutions
See step-by-step solutions with expert insights and AI powered tools for academic success
Step: 2

Step: 3
Ace Your Homework with AI
Get the answers you need in no time with our AI-driven, step-by-step assistance
Get Started
Horngrens Financial And Managerial Accounting The Managerial Chapters And The Financial Chapters Plus Pearson Mylab Accounting With Pearson Global Edition
Authors: Tracie L. Miller Nobles, Brenda L. Mattison, Ella Mae Matsumura
6th Global Edition
1292270756, 978-1292270753