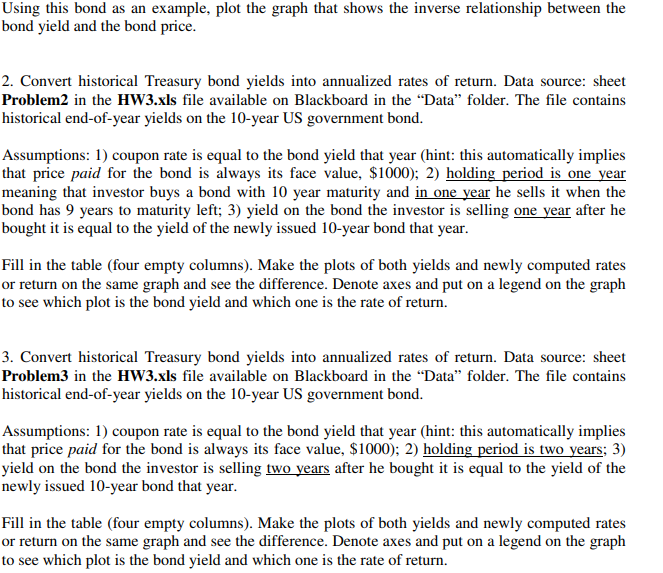
1. Consider a $1,000 face value bond with coupon rate of 4% and time to maturity of 15 years.


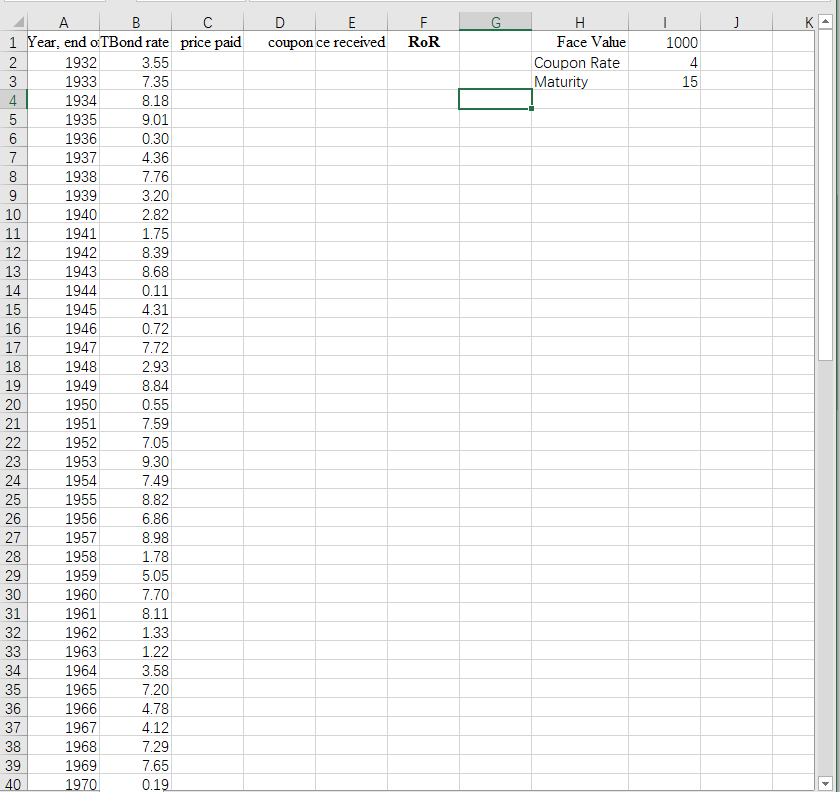
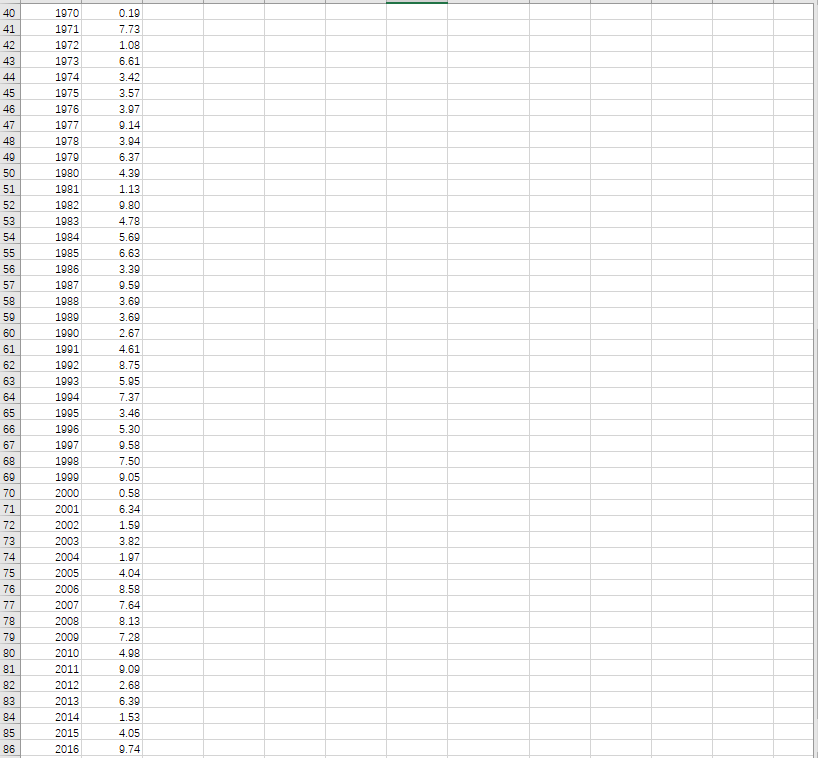
Using this bond as an example, plot the graph that shows the inverse relationship between the bond yield and the bond price. 2. Convert historical Treasury bond yields into annualized rates of return. Data source: sheet Problem2 in the HW3.xls file available on Blackboard in the Data" folder. The file contains historical end-of-year yields on the 10-year US government bond. Assumptions: 1) coupon rate is equal to the bond yield that year (hint: this automatically implies that price paid for the bond is always its face value, $1000); 2) holding period is one year meaning that investor buys a bond with 10 year maturity and in one year he sells it when the bond has 9 years to maturity left; 3) yield on the bond the investor is selling one year after he bought it is equal to the yield of the newly issued 10-year bond that year. Fill in the table (four empty columns). Make the plots of both yields and newly computed rates or return on the same graph and see the difference. Denote axes and put on a legend on the graph to see which plot is the bond yield and which one is the rate of return. 3. Convert historical Treasury bond yields into annualized rates of return. Data source: sheet Problem3 in the HW3.xls file available on Blackboard in the Data" folder. The file contains historical end-of-year yields on the 10-year US government bond. Assumptions: 1) coupon rate is equal to the bond yield that year (hint: this automatically implies that price paid for the bond is always its face value, $1000); 2) holding period is two years; 3) yield on the bond the investor is selling two years after he bought it is equal to the yield of the newly issued 10-year bond that year. Fill in the table (four empty columns). Make the plots of both yields and newly computed rates or return on the same graph and see the difference. Denote axes and put on a legend on the graph to see which plot is the bond yield and which one is the rate of return. 11 G J D E coupon ce received F RoR . Face Value Coupon Rate Maturity 1000 4 15 A B 1 Year, end o: TBond rate price paid 2 1932 3.55 3 1933 7.35 4 1934 8.18 5 1935 9.01 6 1936 0.30 7 1937 4.36 8 1938 7.76 9 1939 3.20 10 1940 2.82 11 1941 1.75 12 1942 8.39 13 1943 8.68 14 1944 0.11 15 1945 4.31 16 1946 0.72 17 1947 7.72 18 1948 2.93 19 1949 8.84 20 1950 0.55 21 1951 7.59 22 1952 7.05 23 1953 9.30 24 1954 7.49 25 1955 8.82 26 1956 6.86 27 1957 8.98 28 1958 1.78 29 1959 5.05 30 1960 7.70 31 1961 8.11 32 1962 1.33 33 1963 1.22 34 1964 3.58 35 1965 7.20 36 1966 4.78 37 1967 4.12 38 1968 7.29 39 1969 7.65 40 1970 0.19 40 41 42 43 44 45 46 47 48 49 50 51 52 53 54 55 56 57 58 59 60 61 62 63 64 65 66 67 68 69 70 71 72 73 74 75 76 77 78 79 80 81 82 83 84 85 86 1970 1971 1972 1973 1974 1975 1976 1977 1978 1979 1980 1981 1982 1983 1984 1985 1986 1987 1988 1989 1990 1991 1992 1993 1994 1905 1996 1997 1998 1999 2000 2001 2002 2003 2004 2005 2006 2007 2008 2009 2010 2011 2012 2013 2014 2015 2016 0.19 7.73 1.08 6.61 3.42 3.57 3.97 9.14 3.94 6.37 4.39 1.13 9.80 4.78 5.69 6.63 3.39 9.59 3.69 3.69 2.67 4.61 8.75 5.95 7.37 3.46 5.30 9.58 7.50 9.05 0.58 6.34 1.59 3.82 1.97 4.04 8.58 7.64 8.13 7.28 4.98 9.09 2.68 6.39 1.53 4.05 9.74 87 88 89 90 91 2017 2018 2019 2020 4.38 7.22 7.97 3.00 Using this bond as an example, plot the graph that shows the inverse relationship between the bond yield and the bond price. 2. Convert historical Treasury bond yields into annualized rates of return. Data source: sheet Problem2 in the HW3.xls file available on Blackboard in the Data" folder. The file contains historical end-of-year yields on the 10-year US government bond. Assumptions: 1) coupon rate is equal to the bond yield that year (hint: this automatically implies that price paid for the bond is always its face value, $1000); 2) holding period is one year meaning that investor buys a bond with 10 year maturity and in one year he sells it when the bond has 9 years to maturity left; 3) yield on the bond the investor is selling one year after he bought it is equal to the yield of the newly issued 10-year bond that year. Fill in the table (four empty columns). Make the plots of both yields and newly computed rates or return on the same graph and see the difference. Denote axes and put on a legend on the graph to see which plot is the bond yield and which one is the rate of return. 3. Convert historical Treasury bond yields into annualized rates of return. Data source: sheet Problem3 in the HW3.xls file available on Blackboard in the Data" folder. The file contains historical end-of-year yields on the 10-year US government bond. Assumptions: 1) coupon rate is equal to the bond yield that year (hint: this automatically implies that price paid for the bond is always its face value, $1000); 2) holding period is two years; 3) yield on the bond the investor is selling two years after he bought it is equal to the yield of the newly issued 10-year bond that year. Fill in the table (four empty columns). Make the plots of both yields and newly computed rates or return on the same graph and see the difference. Denote axes and put on a legend on the graph to see which plot is the bond yield and which one is the rate of return. 11 G J D E coupon ce received F RoR . Face Value Coupon Rate Maturity 1000 4 15 A B 1 Year, end o: TBond rate price paid 2 1932 3.55 3 1933 7.35 4 1934 8.18 5 1935 9.01 6 1936 0.30 7 1937 4.36 8 1938 7.76 9 1939 3.20 10 1940 2.82 11 1941 1.75 12 1942 8.39 13 1943 8.68 14 1944 0.11 15 1945 4.31 16 1946 0.72 17 1947 7.72 18 1948 2.93 19 1949 8.84 20 1950 0.55 21 1951 7.59 22 1952 7.05 23 1953 9.30 24 1954 7.49 25 1955 8.82 26 1956 6.86 27 1957 8.98 28 1958 1.78 29 1959 5.05 30 1960 7.70 31 1961 8.11 32 1962 1.33 33 1963 1.22 34 1964 3.58 35 1965 7.20 36 1966 4.78 37 1967 4.12 38 1968 7.29 39 1969 7.65 40 1970 0.19 40 41 42 43 44 45 46 47 48 49 50 51 52 53 54 55 56 57 58 59 60 61 62 63 64 65 66 67 68 69 70 71 72 73 74 75 76 77 78 79 80 81 82 83 84 85 86 1970 1971 1972 1973 1974 1975 1976 1977 1978 1979 1980 1981 1982 1983 1984 1985 1986 1987 1988 1989 1990 1991 1992 1993 1994 1905 1996 1997 1998 1999 2000 2001 2002 2003 2004 2005 2006 2007 2008 2009 2010 2011 2012 2013 2014 2015 2016 0.19 7.73 1.08 6.61 3.42 3.57 3.97 9.14 3.94 6.37 4.39 1.13 9.80 4.78 5.69 6.63 3.39 9.59 3.69 3.69 2.67 4.61 8.75 5.95 7.37 3.46 5.30 9.58 7.50 9.05 0.58 6.34 1.59 3.82 1.97 4.04 8.58 7.64 8.13 7.28 4.98 9.09 2.68 6.39 1.53 4.05 9.74 87 88 89 90 91 2017 2018 2019 2020 4.38 7.22 7.97 3.00


