Answered step by step
Verified Expert Solution
Link Copied!

Question

1 Approved Answer

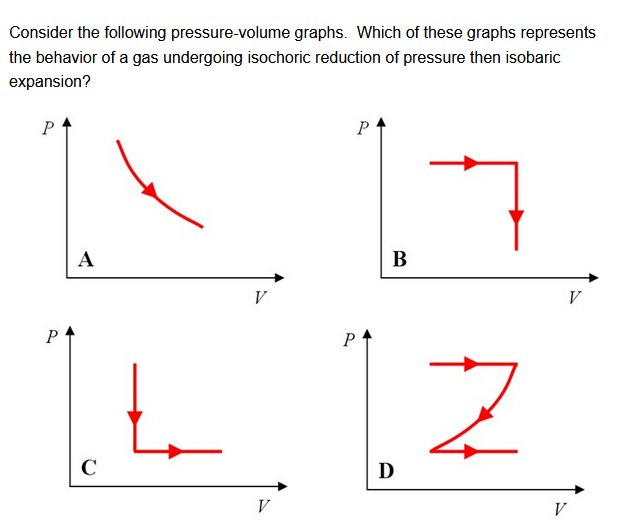
1. Consider the following pressure-volume graphs. Which of these graphs represents expansion? the behavior of a gas undergoing isochoric reduction of pressure then isobaric P

image text in transcribed

1.

image text in transcribedimage text in transcribed
Consider the following pressure-volume graphs. Which of these graphs represents expansion? the behavior of a gas undergoing isochoric reduction of pressure then isobaric P P A B V P V P 4 C D V VA thermodynamic system undergoes the three processes shown in the diagram (A - B, B-C, and C - A). PA = 1.4 x 10⁵ Pa, PB = 7.5 x 10⁵ Pa, VA = 0.02 m3, Vc = 0.10 ma. How much work, in Joules, is done by the system? Please round your answer to the nearest whole number (integer). B B Pressure - - - A C - - - - - V Vc Volume A

Step by Step Solution

There are 3 Steps involved in it

Step: 1

blur-text-image

Get Instant Access to Expert-Tailored Solutions

See step-by-step solutions with expert insights and AI powered tools for academic success

Step: 2

blur-text-image

Step: 3

blur-text-image

Ace Your Homework with AI

Get the answers you need in no time with our AI-driven, step-by-step assistance

Get Started

Recommended Textbook for

Design And Analysis Of Experiments Vol. 1

Authors: Klaus Hinkelmann

1st Edition

0471727563, 9780471727569

More Books

Students also viewed these Physics questions

Question

2. The purpose of the acquisition of the information.

Answered: 1 week ago

Question

1. What is the meaning of the information we are collecting?

Answered: 1 week ago