

Answered step by step
Verified Expert Solution
Question
1 Approved Answer
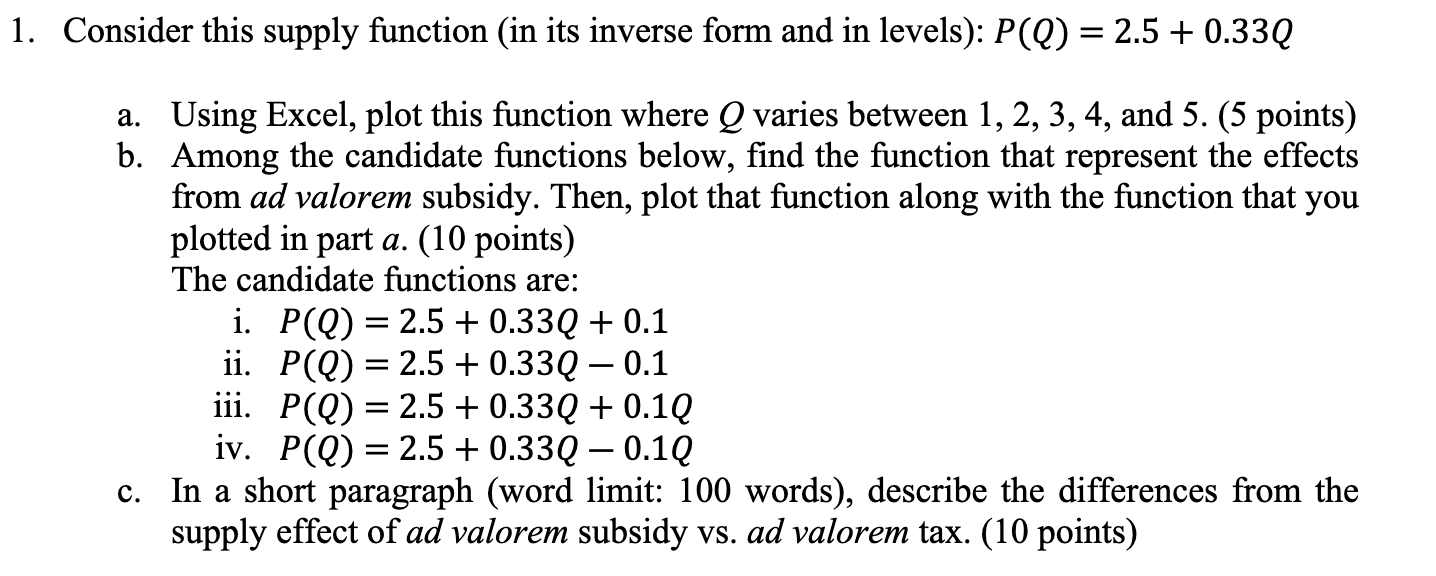
1. Consider this supply function (in its inverse form and in levels): P(Q) = 2.5 + 0.33Q a. Using Excel, plot this function where Q
Step by Step Solution
There are 3 Steps involved in it
Step: 1

Get Instant Access to Expert-Tailored Solutions
See step-by-step solutions with expert insights and AI powered tools for academic success
Step: 2

Step: 3
Ace Your Homework with AI
Get the answers you need in no time with our AI-driven, step-by-step assistance
Get Started
Principles Of Macroeconomics
Authors: N Gregory Mankiw
8th Edition
1305971507, 9781305971509