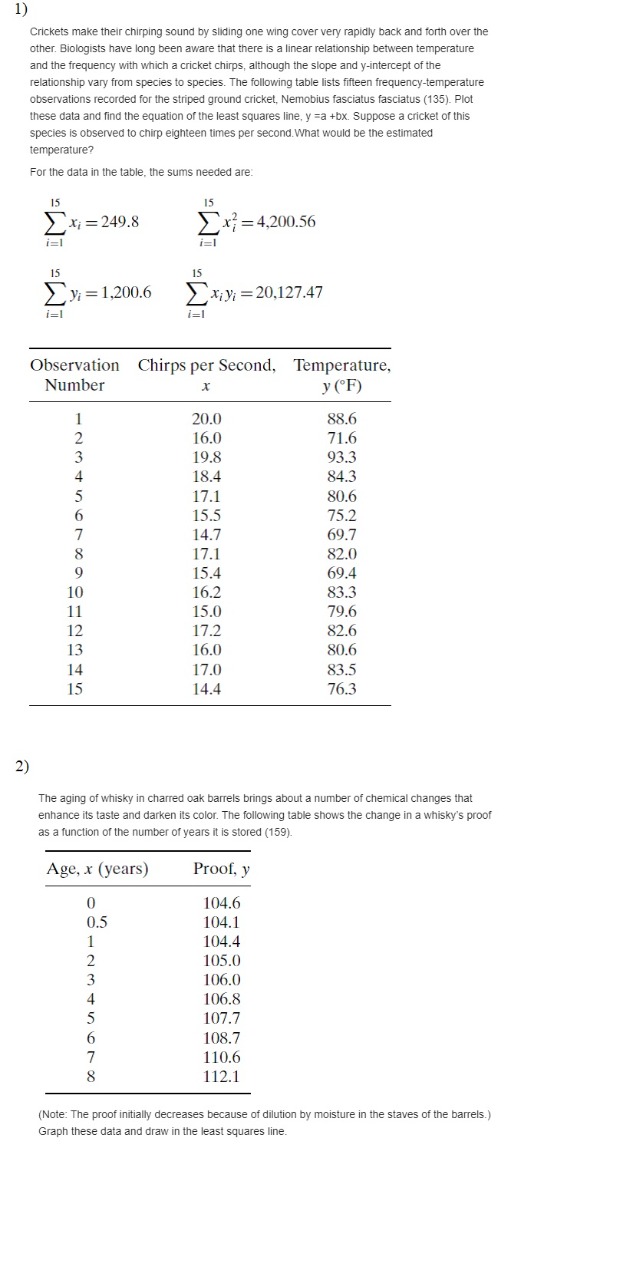
1) Crickets make their chirping sound by sliding one wing cover very rapidly back and forth over the other. Biologists have long been aware that there is a linear relationship between temperature and the frequency with which a cricket chirps, although the slope and y-intercept of the relationship vary from species to species. The following table lists fifteen frequency-temperature observations recorded for the striped ground cricket, Nemobius fasciatus fasciatus (135). Plot these data and find the equation of the least squares line, y =a +bx. Suppose a cricket of this species is observed to chirp eighteen times per second. What would be the estimated temperature? For the data in the table, the sums needed are: 15 15 Exi=249.8 Ex; =4,200.56 i=1 1=1 15 15 yi = 1,200.6 2 x;yi =20,127.47 i=1 Observation Chirps per Second, Temperature, Number X y (F) 20.0 88.6 16.0 71.6 19.8 93.3 18.4 84.3 17.1 80.6 15.5 75.2 14.7 69.7 JEWNE ZOO JAVAWNE 17.1 82.0 15.4 69.4 16.2 83.3 15.0 79.6 17.2 82.6 16.0 80.6 17.0 83.5 14.4 76.3 2) The aging of whisky in charred oak barrels brings about a number of chemical changes that enhance its taste and darken its color. The following table shows the change in a whisky's proof as a function of the number of years it is stored (159). Age, x (years) Proof, y 0 104.6 0.5 104.1 104.4 105.0 106.0 106.8 DJaUAWNE 107.7 108.7 110.6 112.1 (Note: The proof initially decreases because of dilution by moisture in the staves of the barrels.) Graph these data and draw in the least squares line.3) As weler temperature increases, sodium nitrate (NANO,) becomes more soluble. The luluwing table (103) gives the number of parts of sod um nitrate that dissolve in one hundred parts of water. Temperature (degrees Celsius), x Parts Dissolved, y 66.7 71.0 10 76.3 15 80.6 21 85.7 29 929 36 99.4 51 113.6 68 125.1 Calculate the residuals, Y1-)/1, -... )y-jig, and draw the residual pict. Does it suggest That tilling a straight line Brough these data would be appropriate? Use the following sums Calculate the residuals. V1-y1. .... >/9-jo, and disaw the resiavel plot. Does it suggest that firing a straight line through these data would be appropriate? Isa the folowing sums xi =234 Ex=811.3 17 -10.144 M x13 =24,628.6 The following is the residual plot that results from fitting the equation y -6.0+2 0x to a set of n - 10 pointe. What, if arryuning, would be wong with predicung dial y will equal 30.0 when x - 127 N Residual 2 6 8 The relationship betwen school funding and shaoent performance continues to be a hotly debated political and phicsophical issue. Typical of the data available are the following figures. Strowwing The per pupil expenditures and graduation rate lut 26 randomly chosen districts in Massachusetts Graph the dala and superimpose the least squares line, y = a + bx. What would you conclude about the xy-relationship" Use the following sums * =360 Ex=2,256.6 1=1 26 26 x =5,365.08 2x>=31,402 1-1 Spending per Pupil District (in 1000s). x Graduation Rate Dighton-Rehoboth $10.0 88.7 Duxbury $10.2 93.2 Tynesborough $10.2 95.1 Lynnfield $10.3 94.0 Southwick-Tolland $10.3 88.3 Clinton $10.8 89.9 Athol-Royalston $11.0 67.7 Tantasqua $11.0 90.2 Aver $11.2 95.5 Adams-Cheshire $11.6 75.2 Danvers $12.1 84.6 Lee $12 3 85.0 Needham $12.6 94,8 New Bedford $12.7 56.1 Springfield $12.9 54.4 Manchester Essex $13.0 97.9 Dedham $13.9 83.0 Lexington $14.5 94.0 Chatham $14.7 91.4 Newton $15.5 94.2 Blackstone Valley $16.4 97.2 Concord Carlisle $17.5 94.4 Pathfinder $18.1 78.6 Nantucket $20.8 87.6 Essex $22.4 93.3 Provincetown $24.0 92.3 Source: profiles doe. massedu/state-reporUppx.aspx


