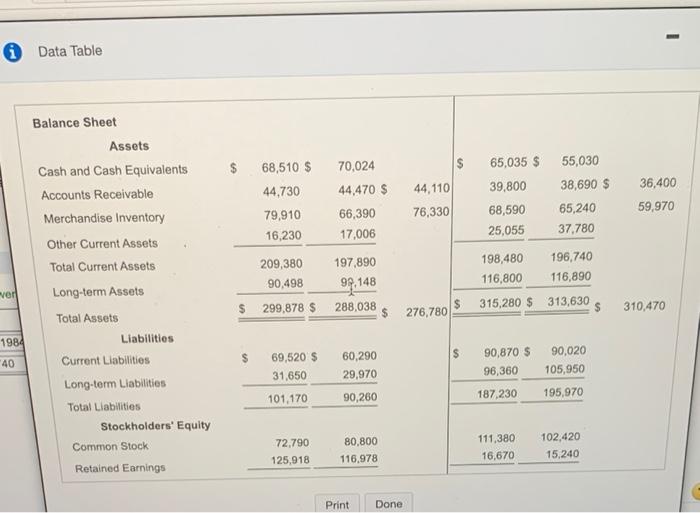
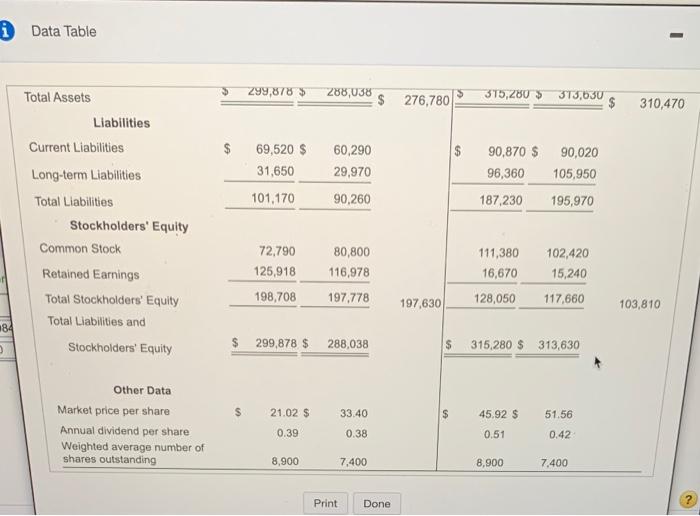
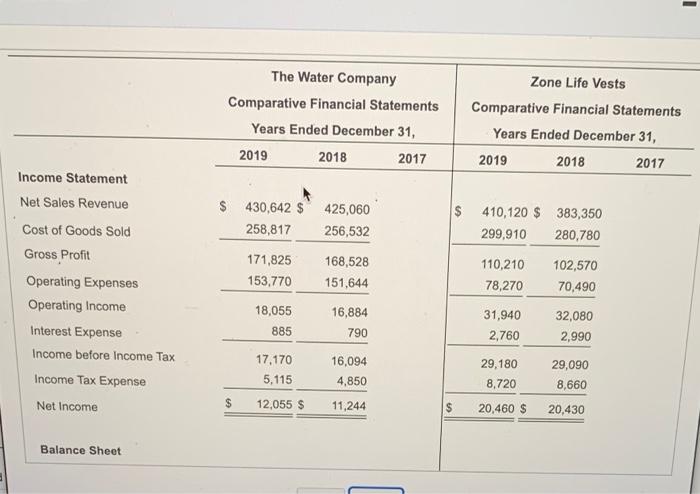
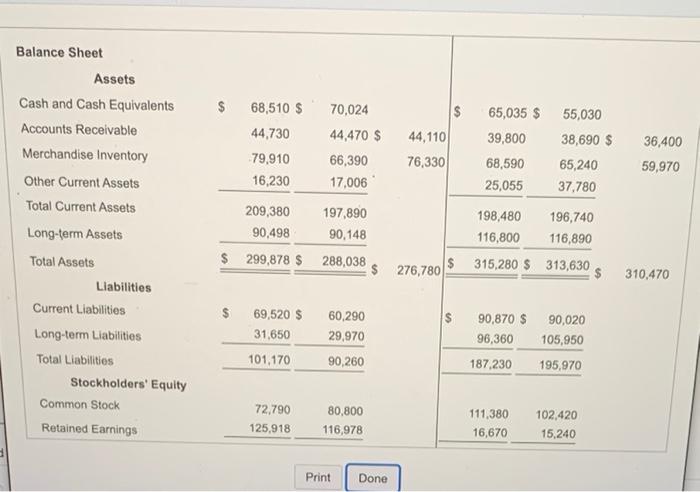
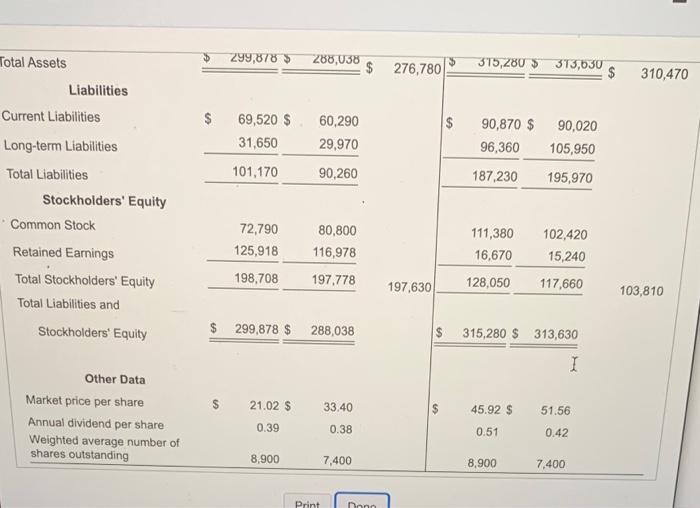
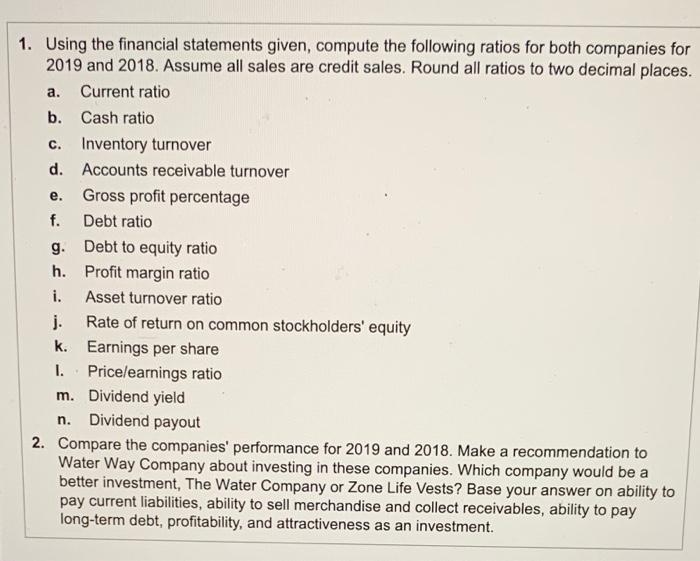
1 Data Table $ 68,510 $ s 65,035 $ 44,110 36,400 44,730 79,910 16,230 70,024 44,470 $ 66,390 17,006 55,030 38,690 $ 65,240 37.780 39,800 68,590 25,055 76,330 59,970 Balance Sheet Assets Cash and Cash Equivalents Accounts Receivable Merchandise Inventory Other Current Assets Total Current Assets Long-term Assets Total Assets Liabilities Current Liabilities Long-term Liabilities Total Liabilities Stockholders' Equity Common Stock Retained Earnings 209,380 197,890 90,498 92,148 $ 299,878 $ 288,038 $ 276,780 198,480 196,740 116,800 116,890 315,280 $ 313,630 ven 310,470 1984 $ "40 69,520 $ 31,650 101,170 60,290 29,970 90,260 90,870 $ 96,360 187,230 90,020 105,950 195,970 72,790 125,918 80,800 116.978 111,380 16,670 102,420 15,240 Print Done i Data Table 299,878 $ 288,038 $ 276,780 > 375,280 > 373,630 310,470 $ 69,520 $ 31,650 101,170 60,290 29,970 90,260 90,870 $ 96,360 187,230 90,020 105,950 195,970 Total Assets Liabilities Current Liabilities Long-term Liabilities Total Liabilities Stockholders' Equity Common Stock Retained Earnings Total Stockholders' Equity Total Liabilities and Stockholders' Equity 72,790 125,918 198,708 80,800 116,978 197,778 111,380 16,670 128,050 102,420 15,240 117,660 197,630 103,810 184 $ 299,878 $ 288,038 $ 315,280 S 313,630 $ 21.02 $ 33.40 51.56 Other Data Market price per share Annual dividend per share Weighted average number of shares outstanding 45.92 $ 0.51 0.39 0.38 0.42 8,900 7.400 8.900 7.400 Print Done - The Water Company Comparative Financial Statements Years Ended December 31, 2019 2018 2017 Zone Life Vests Comparative Financial Statements Years Ended December 31, 2019 2017 2018 S 430,642 $425,060 258,817 256,532 $ 410,120 $ 383,350 299,910 280,780 171,825 153,770 168,528 151,644 Income Statement Net Sales Revenue Cost of Goods Sold Gross Profit Operating Expenses Operating Income Interest Expense Income before Income Tax Income Tax Expense Net Income 110,210 78,270 102,570 70,490 18,055 885 16,884 790 31,940 2,760 32,080 2,990 17,170 5.115 16,094 4,850 29,180 8,720 29,090 8,660 $ 12,055 $ 11,244 $ 20,460 $ 20,430 Balance Sheet $ 55,030 $ 68,510 $ 44,730 79,910 16,230 70,024 44,470 $ 66,390 17,006 $ 44,110 76,330 65,035 $ 39,800 68,590 25,055 36,400 38,690 $ 65,240 37,780 59,970 Balance Sheet Assets Cash and Cash Equivalents Accounts Receivable Merchandise Inventory Other Current Assets Total Current Assets Long-term Assets Total Assets Liabilities Current Liabilities Long-term Liabilities Total Liabilities Stockholders' Equity Common Stock Retained Earnings 209,380 197,890 198,480 196,740 90,498 90,148 116,800 116,890 $ 299,878 $ 288,038 $ 276,780 $ 315,280 $ 313,630 310,470 $ 69,520 $ 31,650 101,170 60,290 29,970 90,260 90,870 $ 96,360 187,230 90,020 105,950 195,970 72,790 125,918 80,800 116,978 111,380 16,670 102,420 15,240 Print Done 299,878 $ 288,038 $ $ 276,780 375,280 $ 313,630 310,470 $ 69,520 $ 31,650 60,290 29,970 90,260 90,870 $ 96,360 90,020 105,950 101,170 187,230 195,970 Total Assets Liabilities Current Liabilities Long-term Liabilities Total Liabilities Stockholders' Equity Common Stock Retained Earnings Total Stockholders' Equity Total Liabilities and Stockholders' Equity 72,790 125,918 80,800 116,978 111,380 16,670 102,420 15,240 198,708 197,778 197,630 128,050 117,660 103,810 $ 299,878 $ 288,038 $ 315,280 $ 313,630 I $ 21.02 $ 33,40 Other Data Market price per share Annual dividend per share Weighted average number of shares outstanding 45.92 $ 51.56 0.39 0.38 0.51 0.42 8.900 7,400 8,900 7,400 Print Donn C. e. 1. Using the financial statements given, compute the following ratios for both companies for 2019 and 2018. Assume all sales are credit sales. Round all ratios to two decimal places. a. Current ratio b. Cash ratio Inventory turnover d. Accounts receivable turnover Gross profit percentage f. Debt ratio g. Debt to equity ratio h. Profit margin ratio i. Asset turnover ratio j. Rate of return on common stockholders' equity k. Earnings per share I. Pricelearnings ratio m. Dividend yield Dividend payout 2. Compare the companies' performance for 2019 and 2018. Make a recommendation to Water Way Company about investing in these companies. Which company would be a better investment, The Water Company or Zone Life Vests? Base your answer on ability to pay current liabilities, ability to sell merchandise and collect receivables, ability to pay long-term debt, profitability, and attractiveness as an investment. n