Answered step by step
Verified Expert Solution
Question
1 Approved Answer
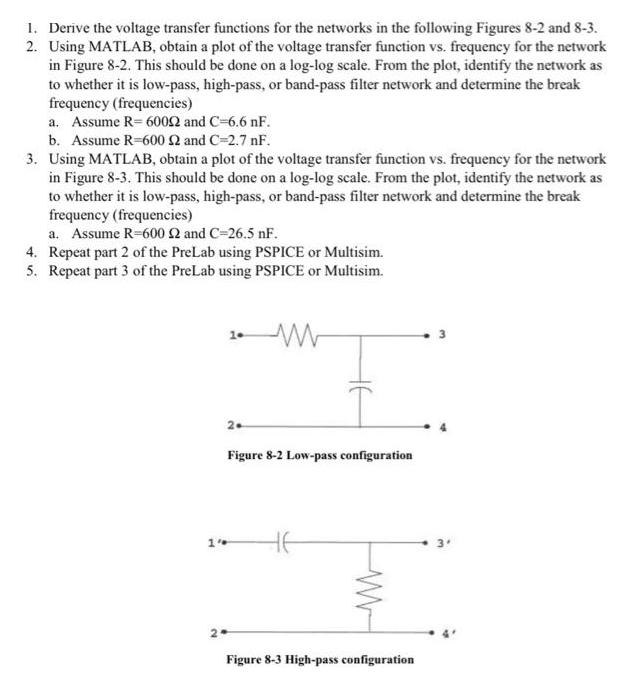
1. Derive the voltage transfer functions for the networks in the following Figures 8-2 and 8-3. 2. Using MATLAB, obtain a plot of the

1. Derive the voltage transfer functions for the networks in the following Figures 8-2 and 8-3. 2. Using MATLAB, obtain a plot of the voltage transfer function vs. frequency for the network in Figure 8-2. This should be done on a log-log scale. From the plot, identify the network as to whether it is low-pass, high-pass, or band-pass filter network and determine the break frequency (frequencies) a. Assume R-60052 and C-6.6 nF. b. Assume R-600 2 and C=2.7 nF. 3. Using MATLAB, obtain a plot of the voltage transfer function vs. frequency for the network in Figure 8-3. This should be done on a log-log scale. From the plot, identify the network as to whether it is low-pass, high-pass, or band-pass filter network and determine the break frequency (frequencies) a. Assume R-600 2 and C=26.5 nF. 4. Repeat part 2 of the PreLab using PSPICE or Multisim. 5. Repeat part 3 of the PreLab using PSPICE or Multisim. 2. 1. Figure 8-2 Low-pass configuration 1" 2. ww Figure 8-3 High-pass configuration
Step by Step Solution
★★★★★
3.39 Rating (158 Votes )
There are 3 Steps involved in it
Step: 1

Get Instant Access to Expert-Tailored Solutions
See step-by-step solutions with expert insights and AI powered tools for academic success
Step: 2

Step: 3

Ace Your Homework with AI
Get the answers you need in no time with our AI-driven, step-by-step assistance
Get Started


