Answered step by step
Verified Expert Solution
Question
1 Approved Answer
1 Distribution Tables Normal Distribution z score This is the graph of a standard normal distribution that has a horizontal axis labeled from -5 to
1
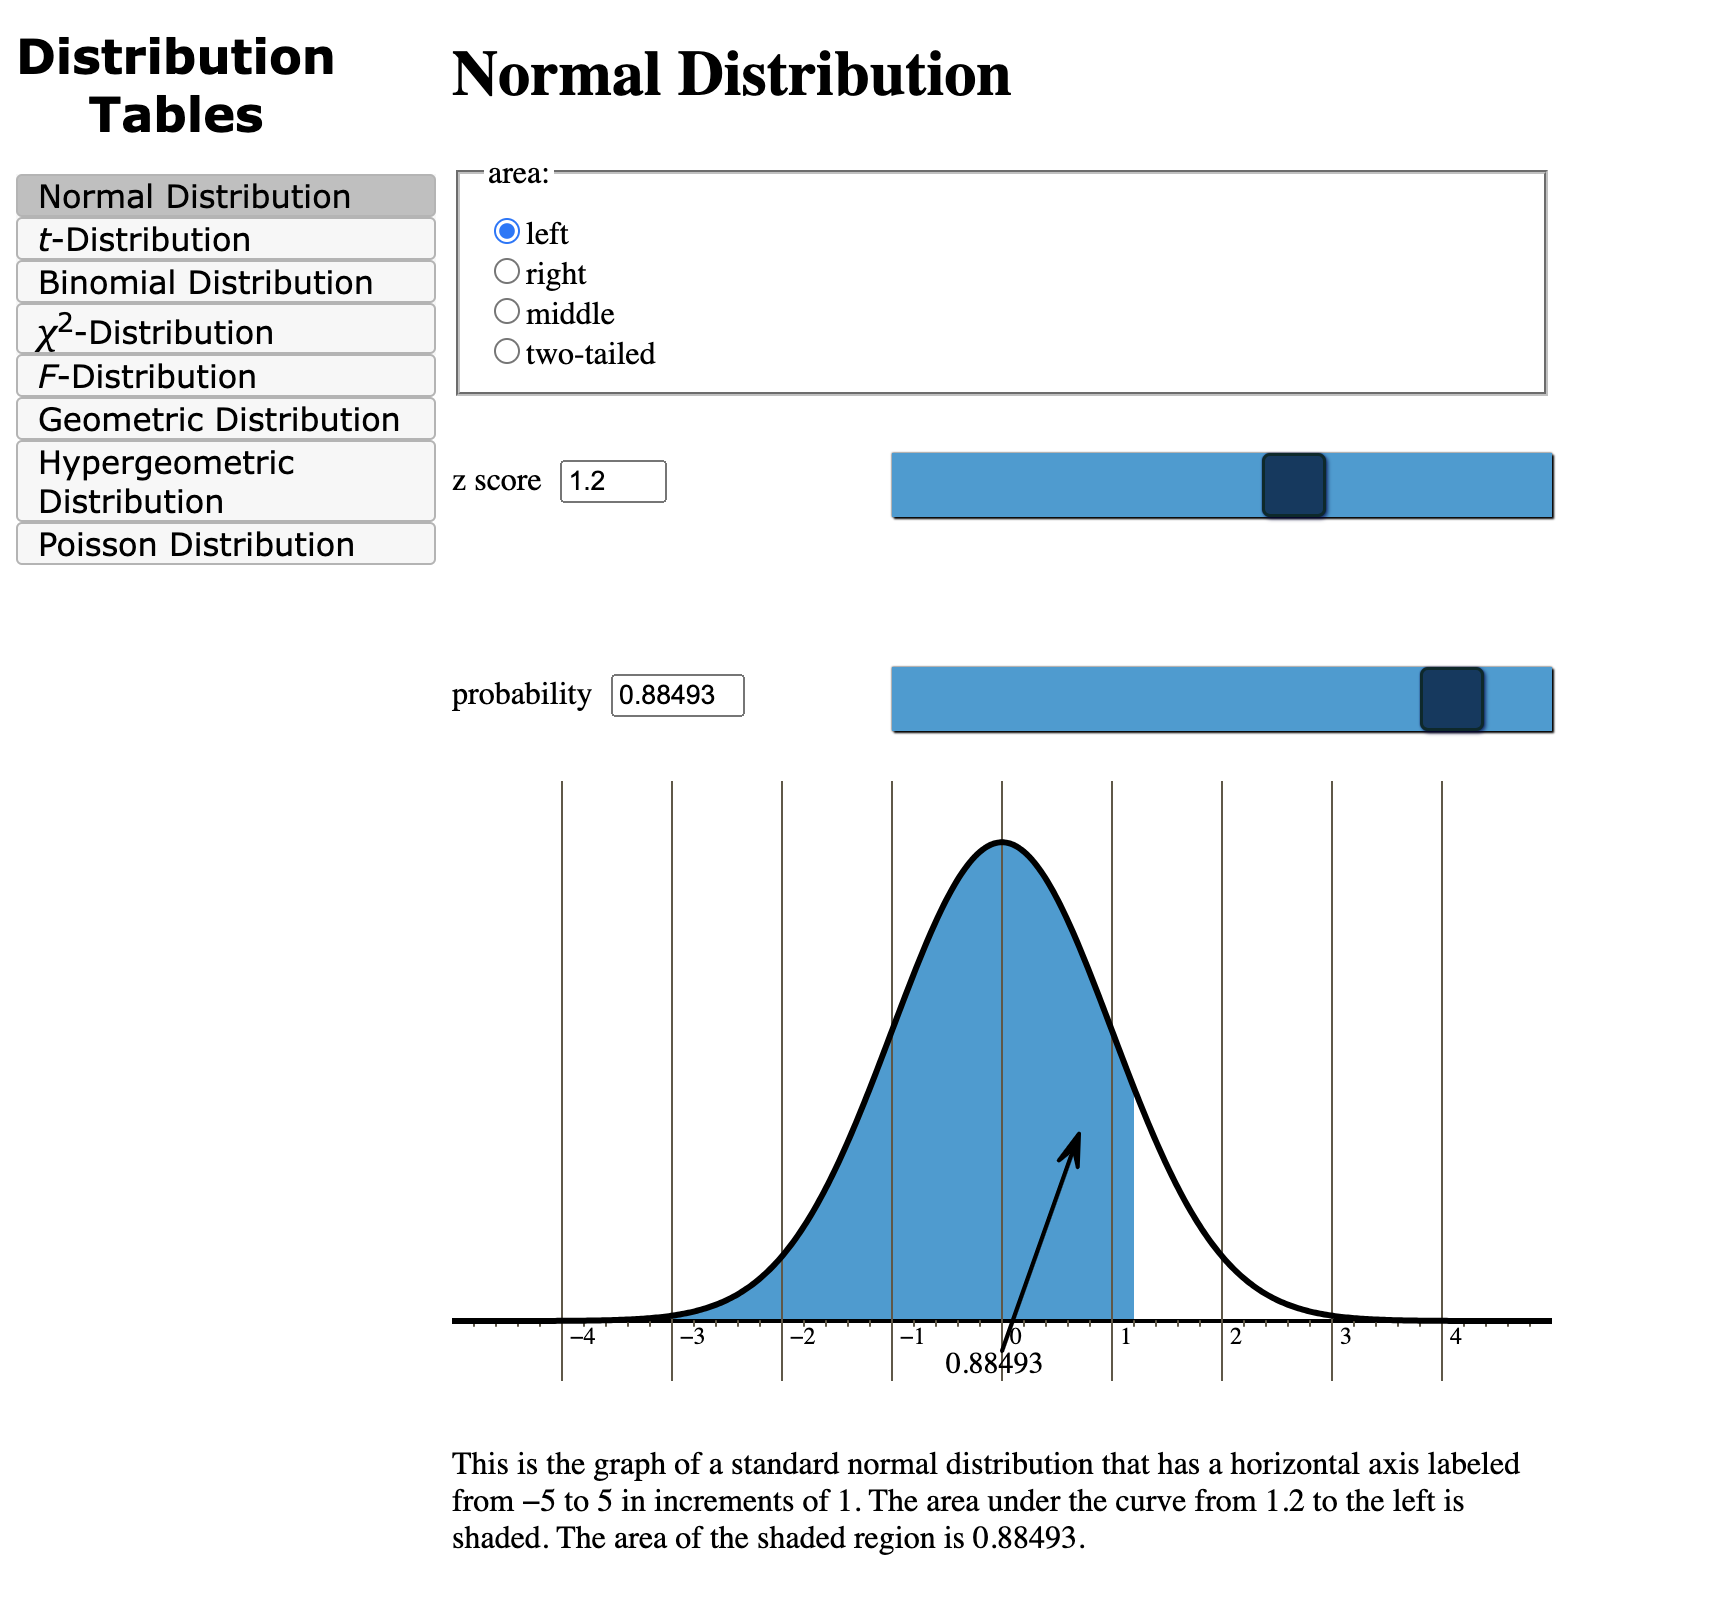
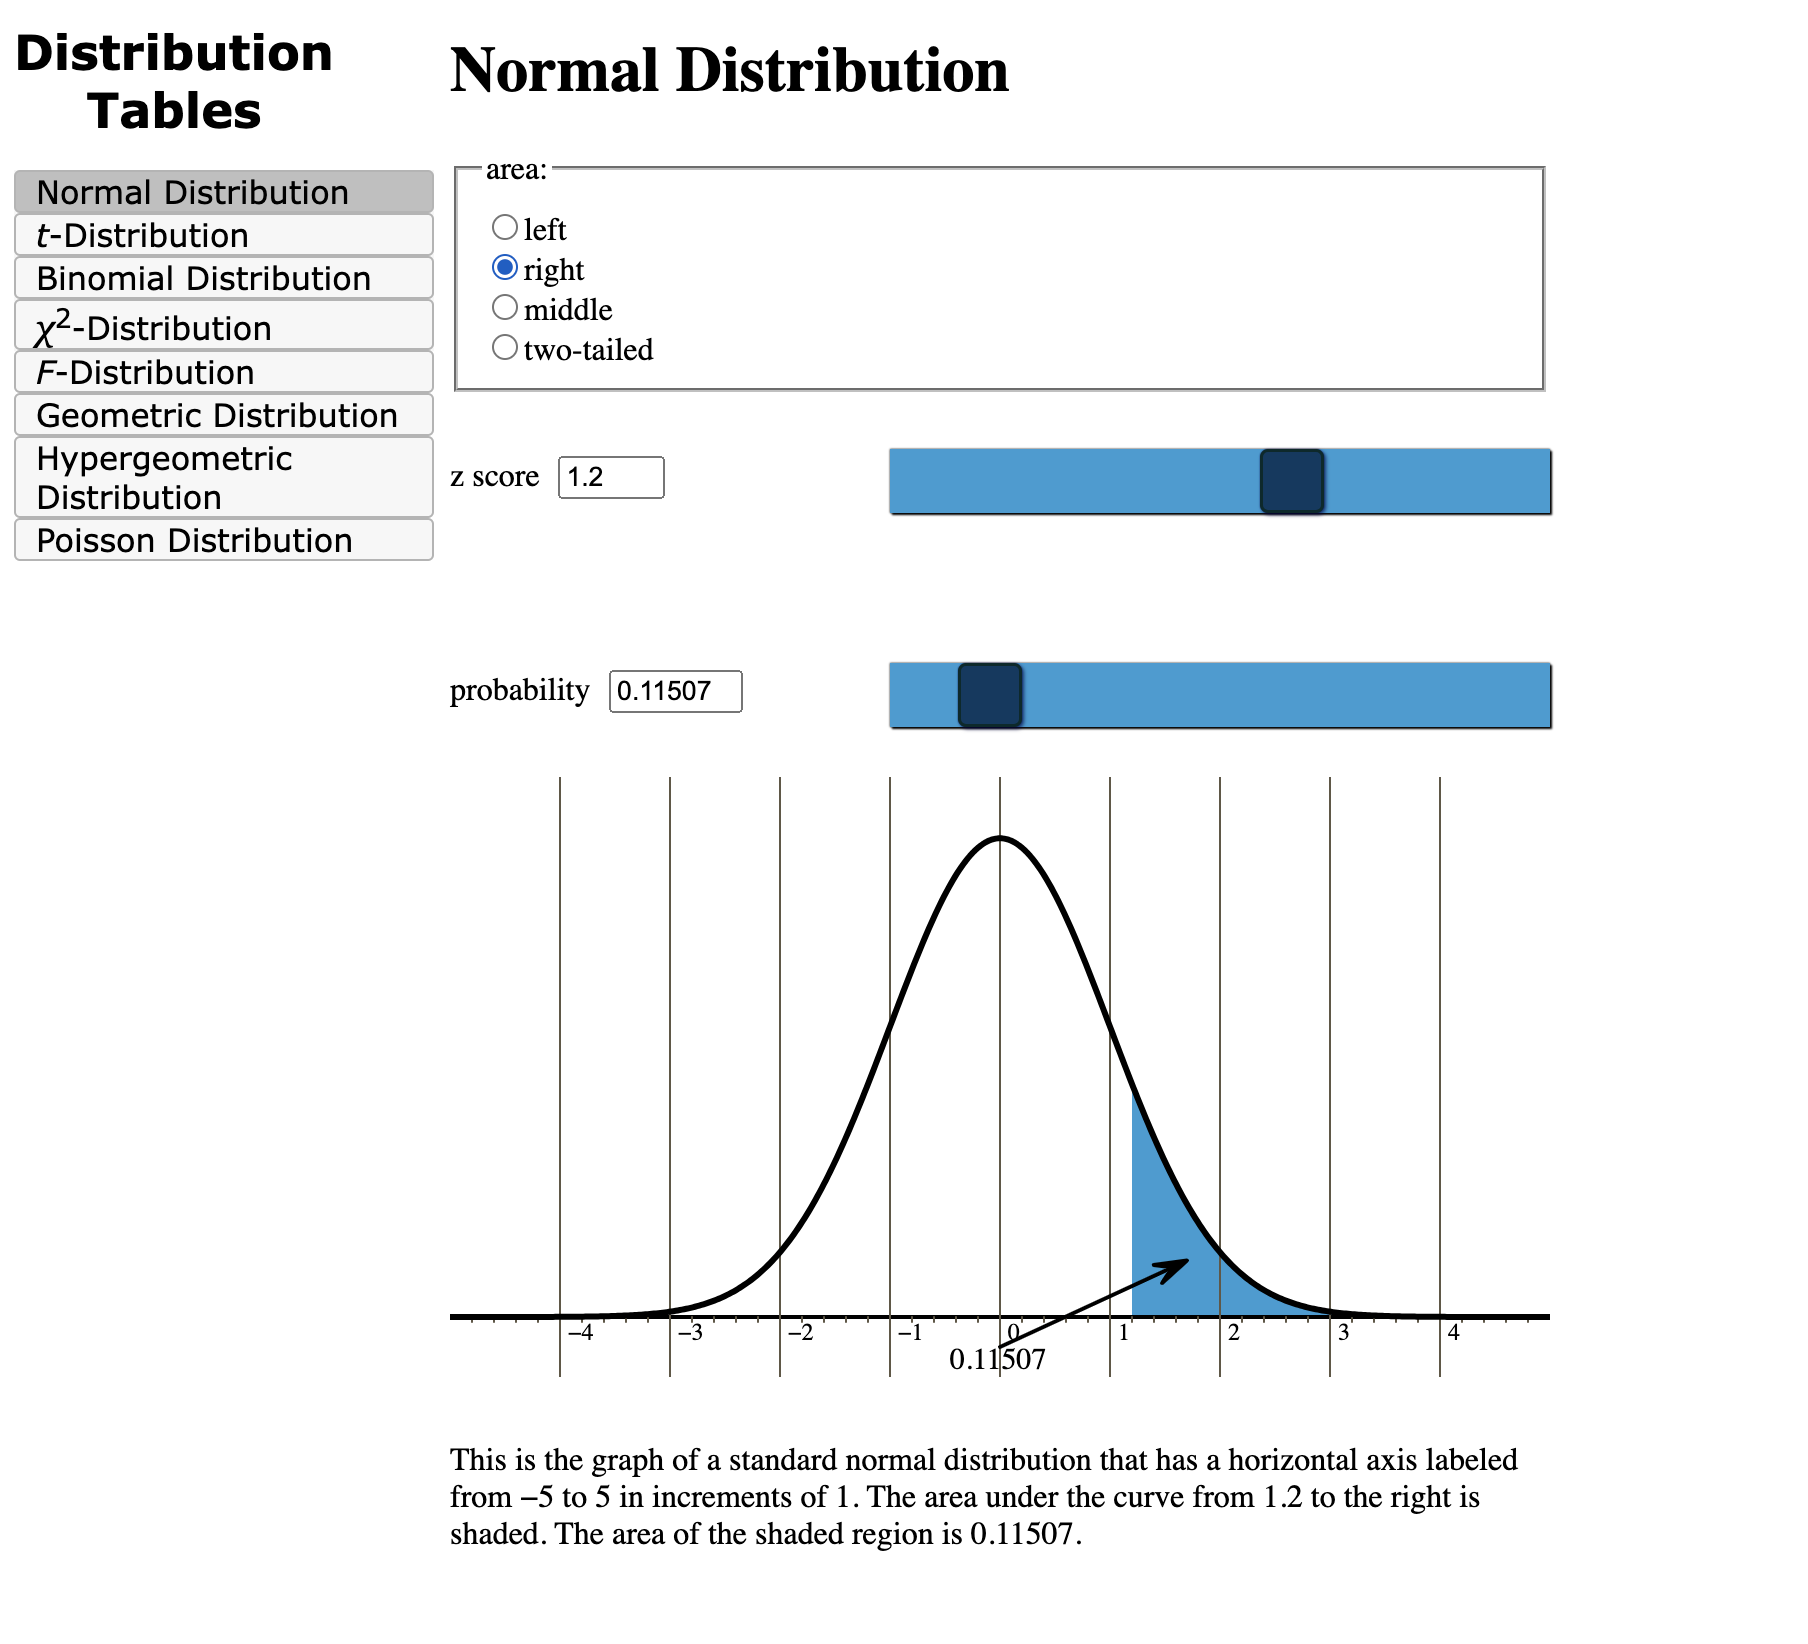
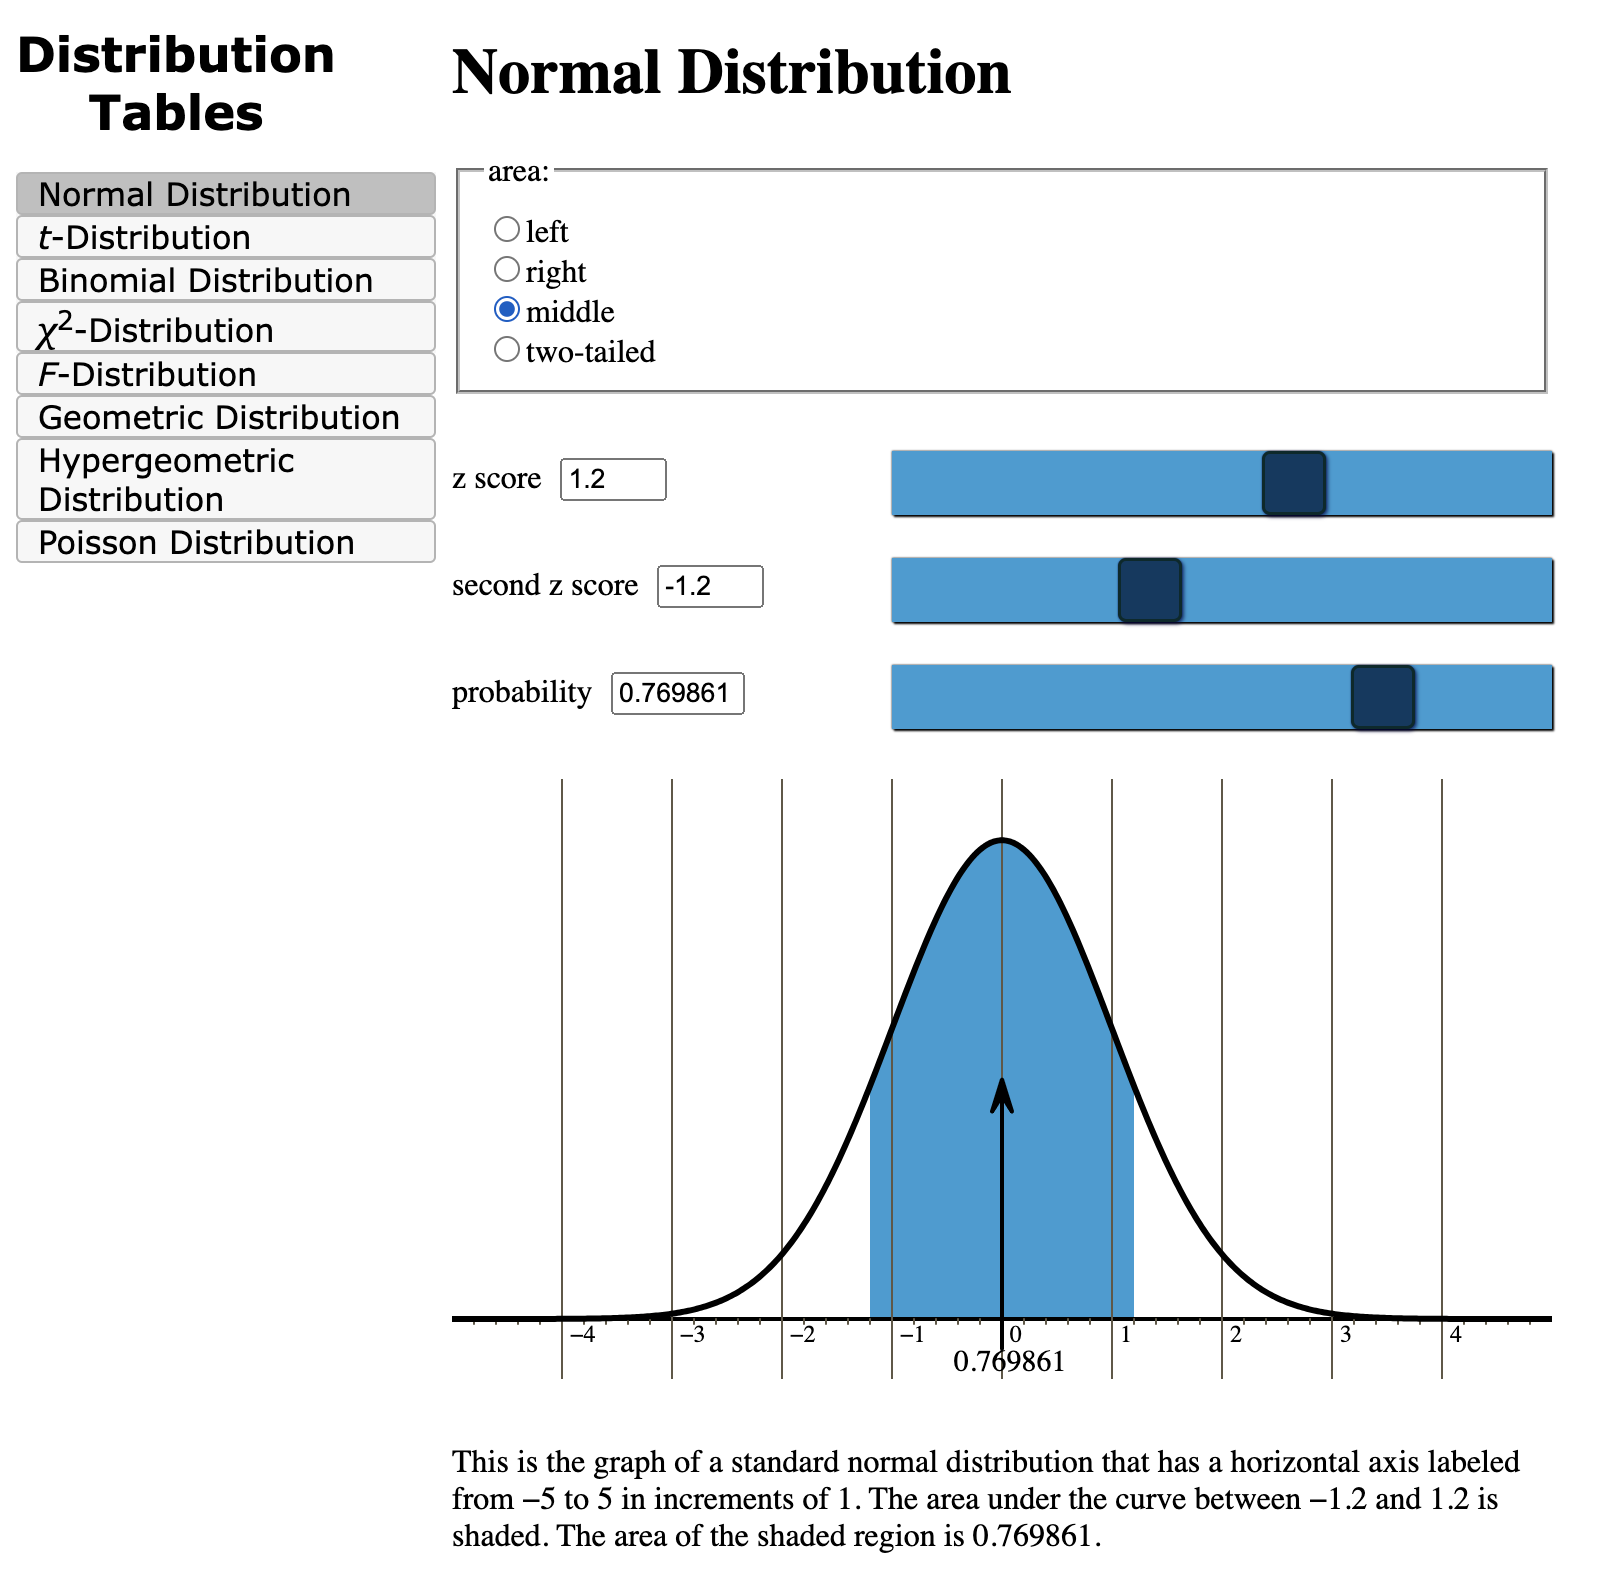
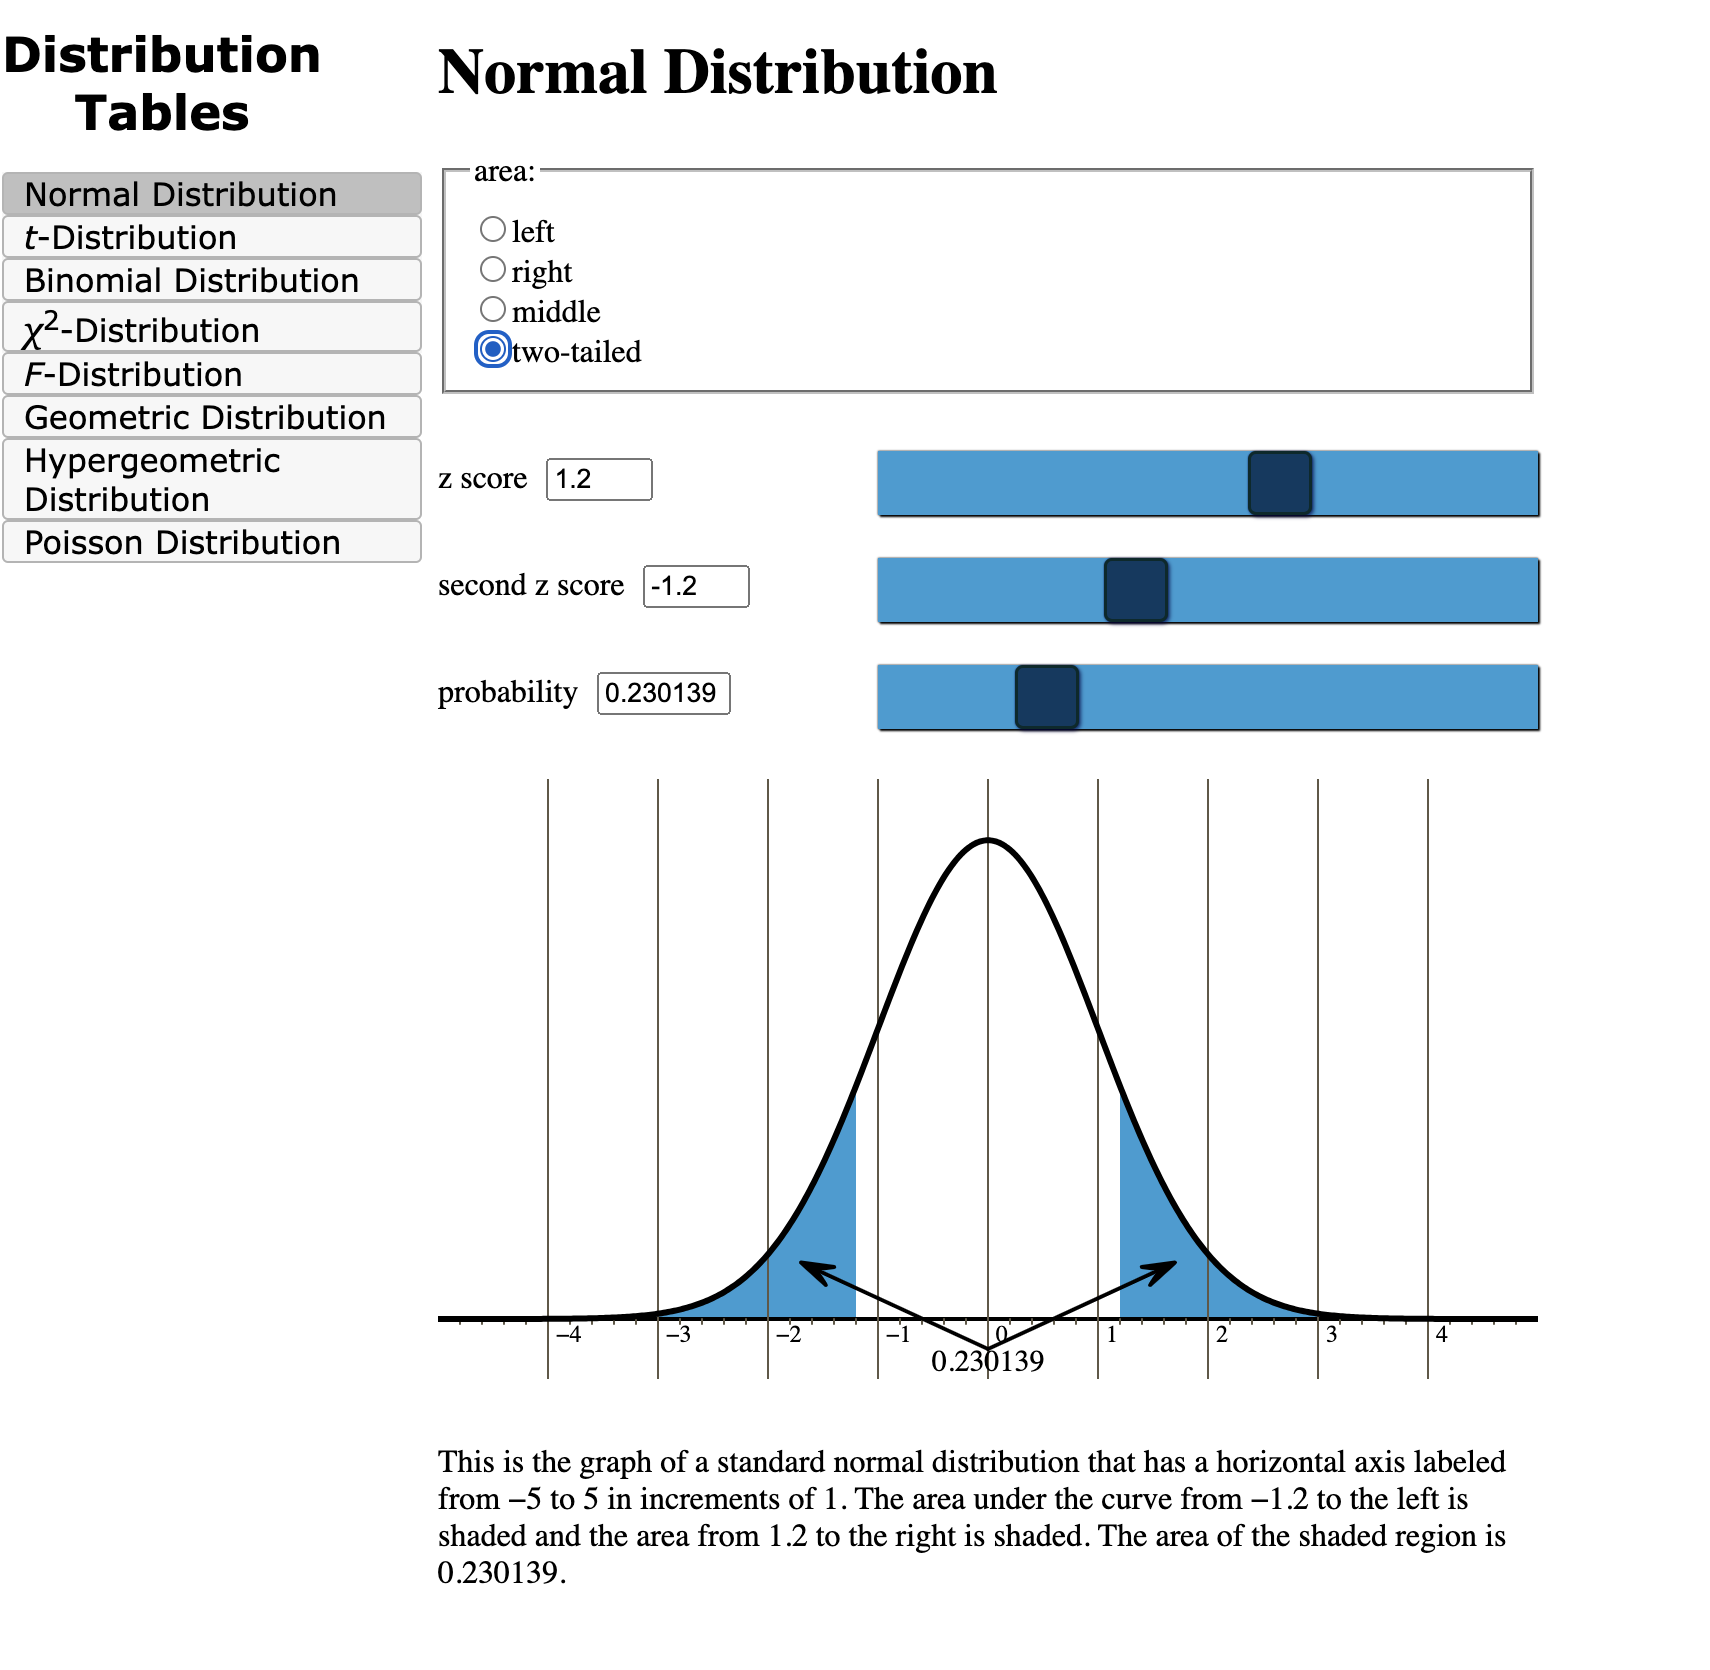
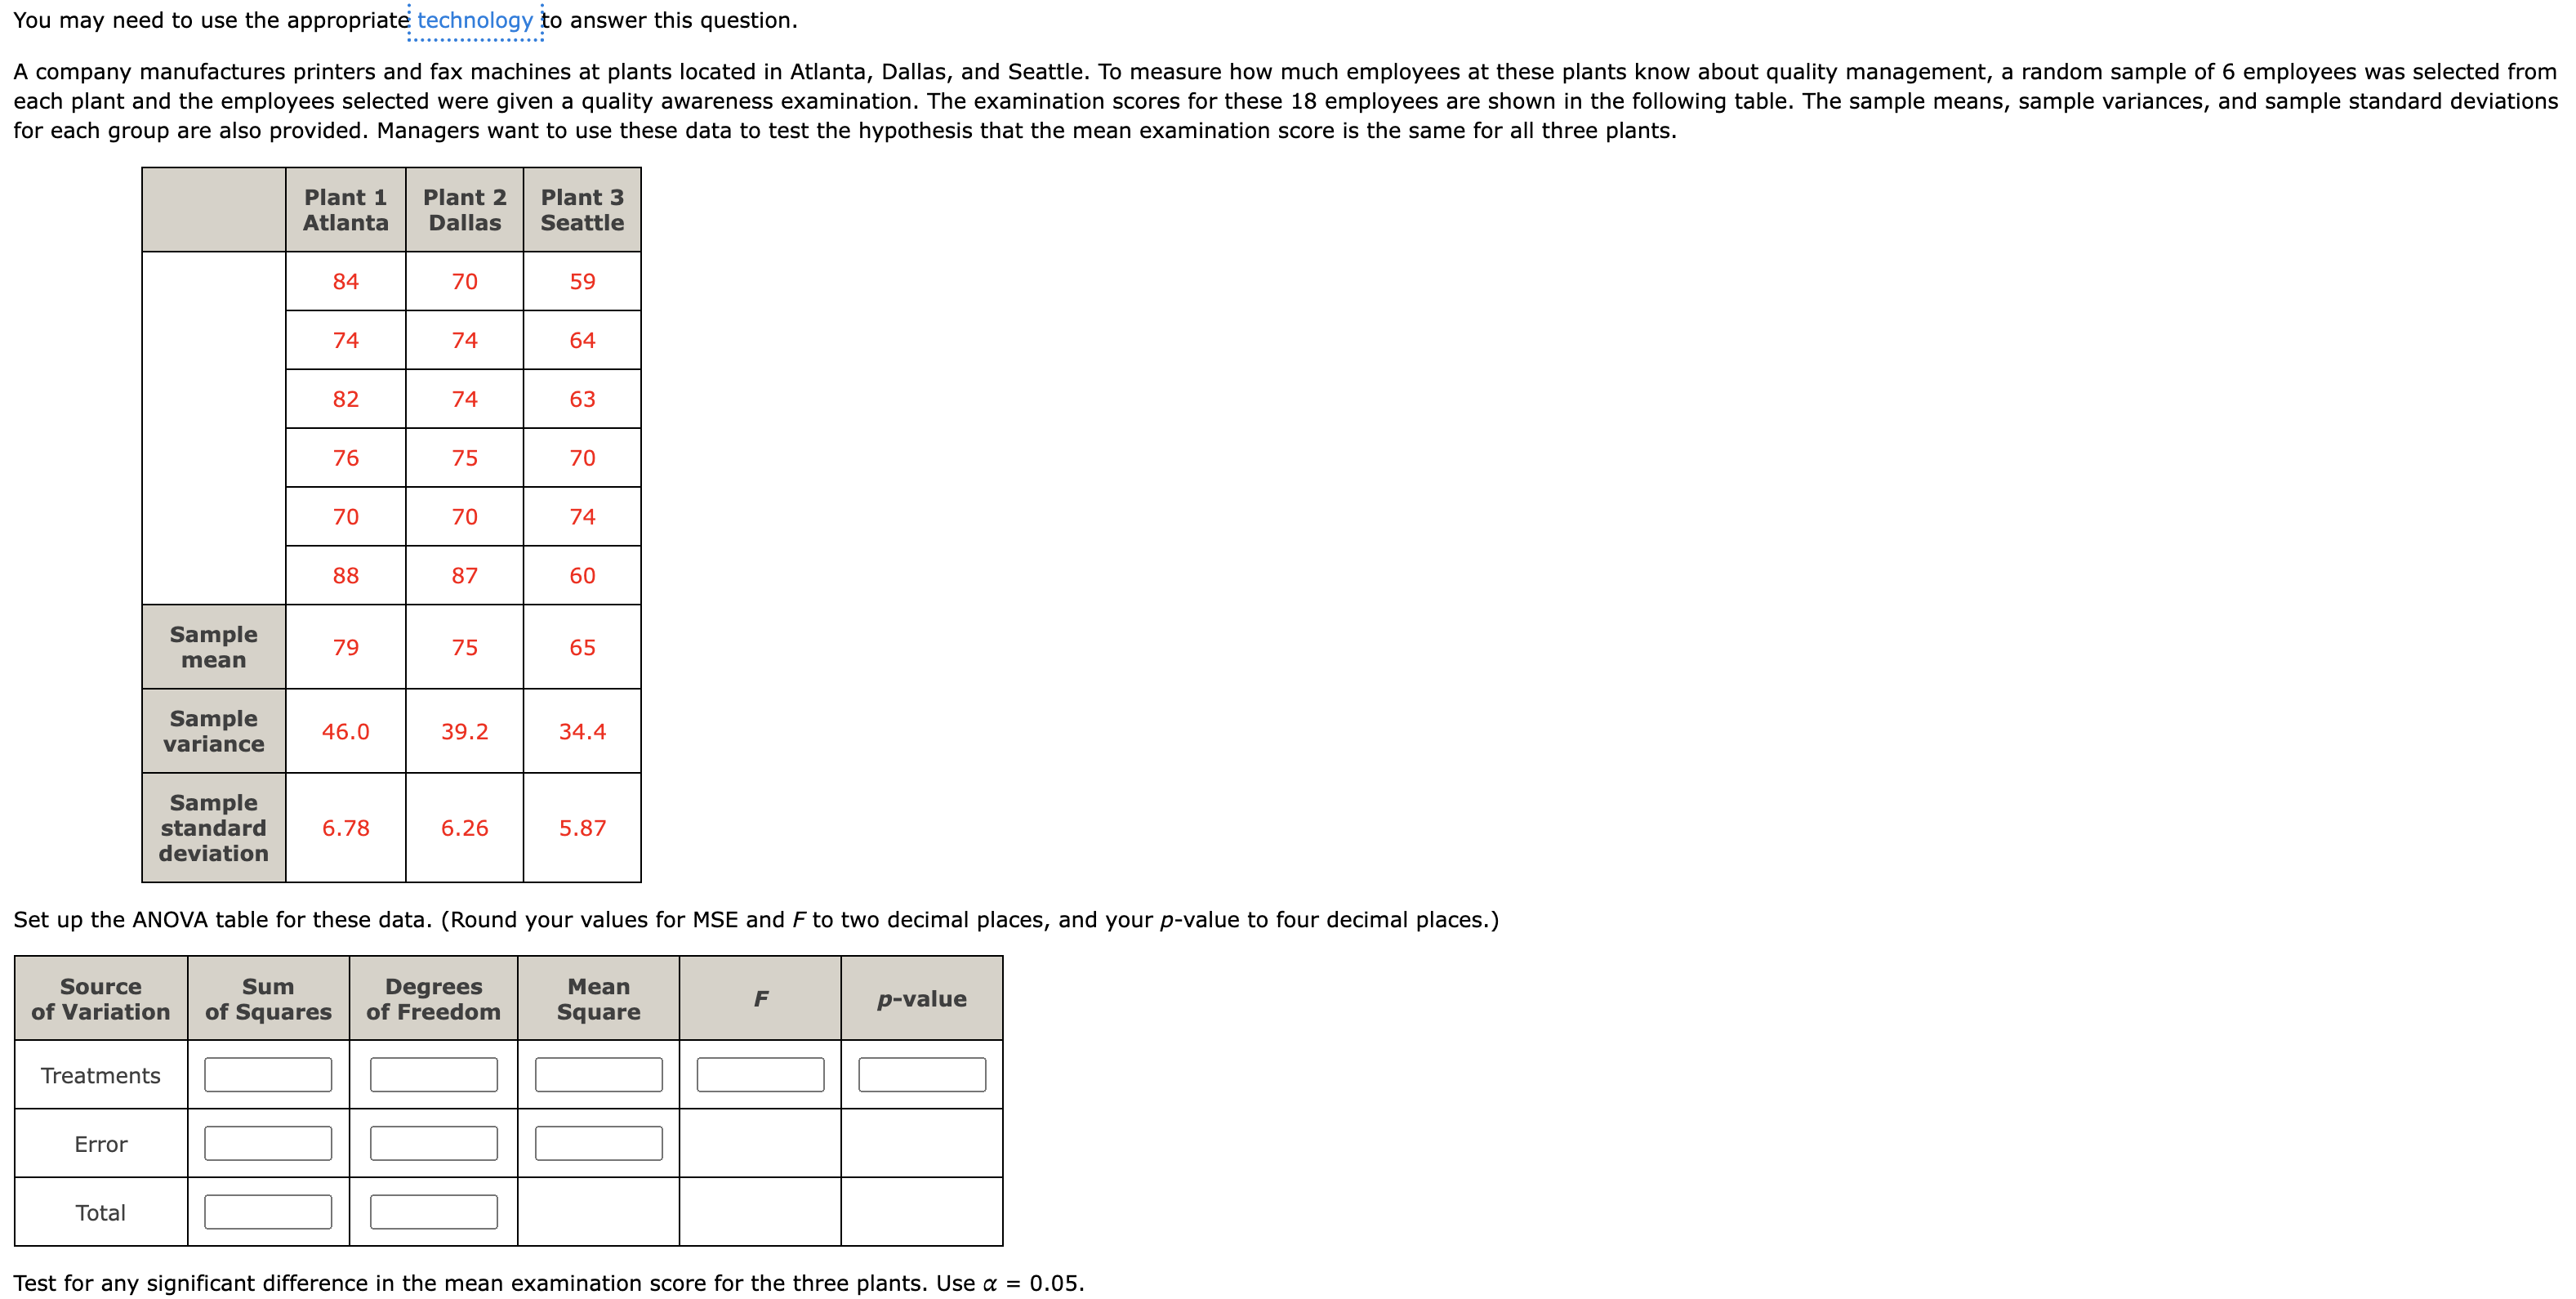
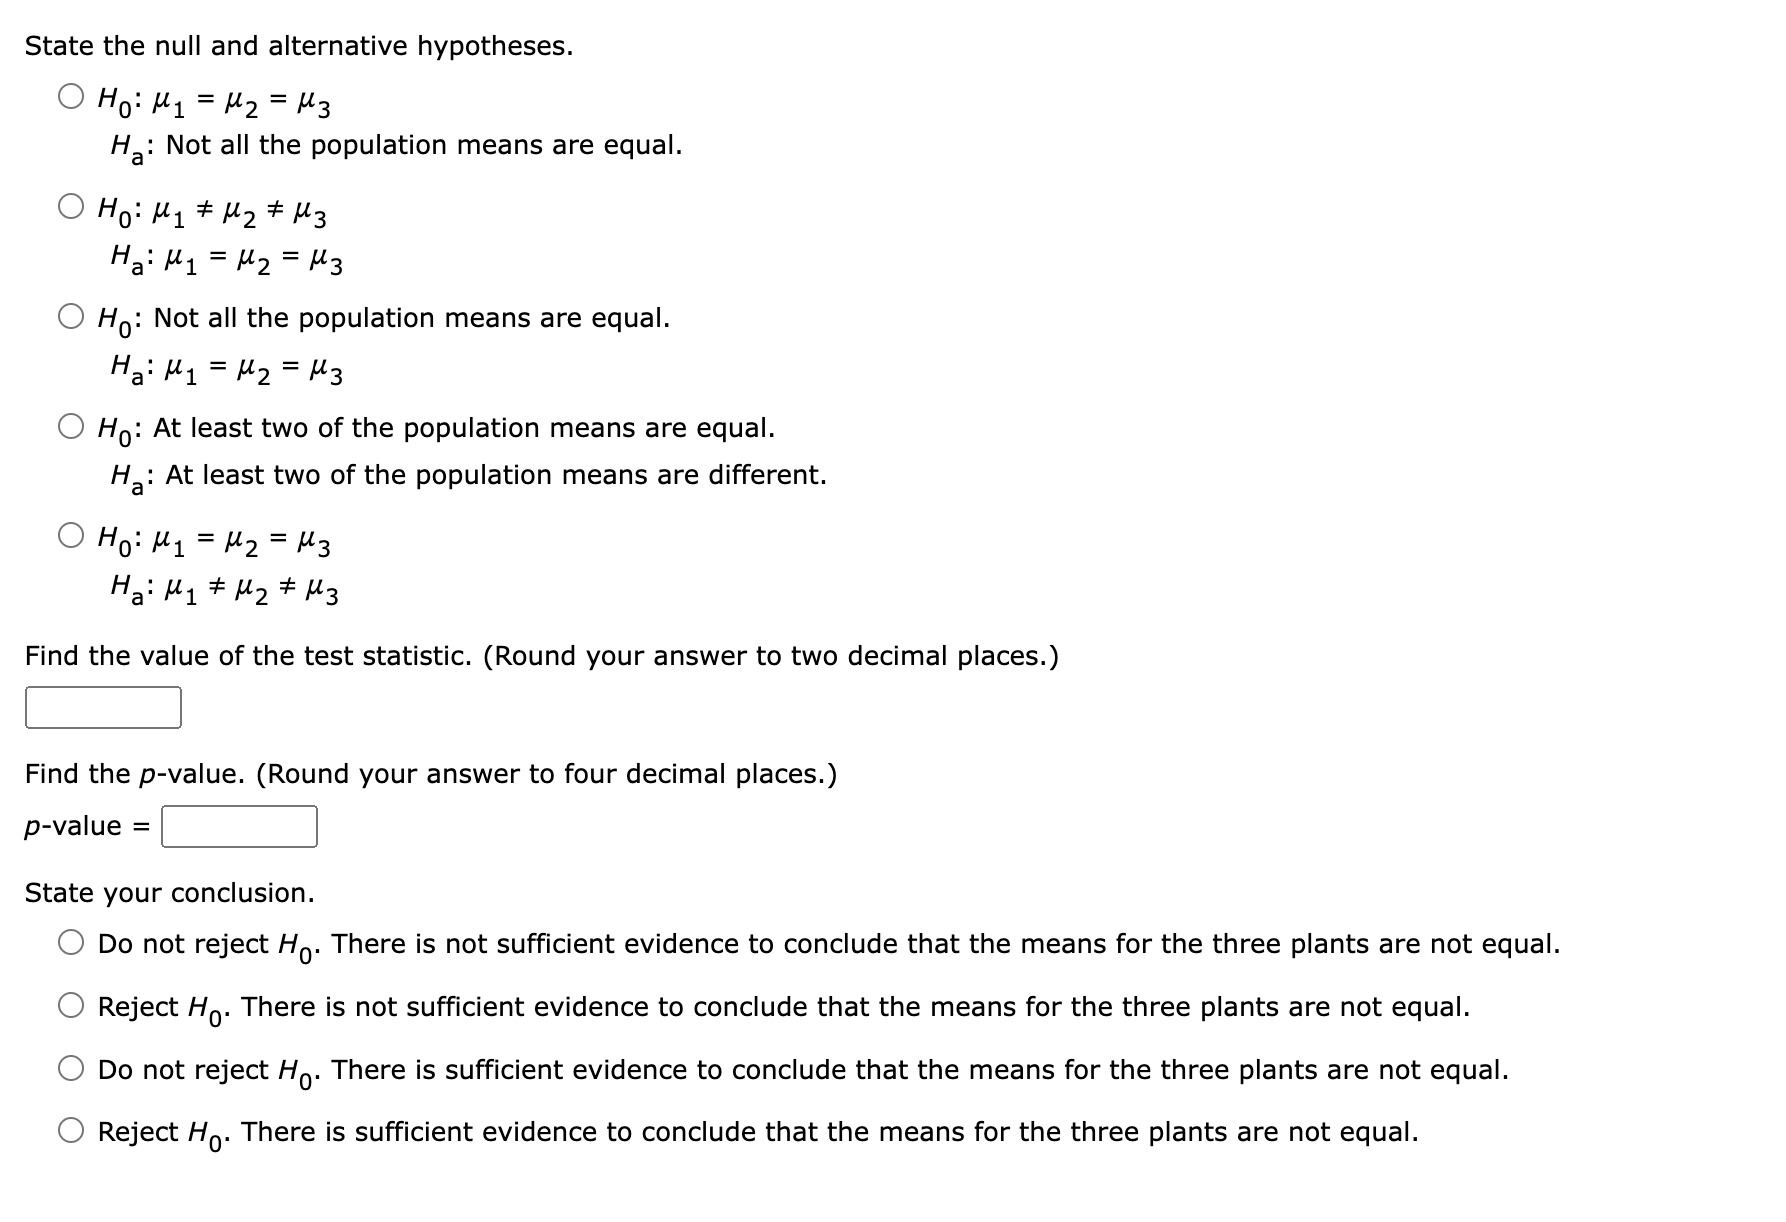
Distribution Tables Normal Distribution z score This is the graph of a standard normal distribution that has a horizontal axis labeled from -5 to 5 in increments of 1 . The area under the curve from 1.2 to the left is shaded. The area of the shaded region is 0.88493 . Distribution Tables Normal Distribution area left right middle two-tailed z score probability 0.11507 This is the graph of a standard normal distribution that has a horizontal axis labeled from -5 to 5 in increments of 1 . The area under the curve from 1.2 to the right is shaded. The area of the shaded region is 0.11507. Normal Distribution area:leftrightmiddletwo-tailed Farea: left right middle two-tailed z score second z score probability This is the graph of a standard normal distribution that has a horizontal axis labeled from -5 to 5 in increments of 1 . The area under the curve between -1.2 and 1.2 is shaded. The area of the shaded region is 0.769861 . Distribution Tables Normal Distribution area: left right middle two-tailed z score second z score probability This is the graph of a standard normal distribution that has a horizontal axis labeled from -5 to 5 in increments of 1 . The area under the curve from -1.2 to the left is shaded and the area from 1.2 to the right is shaded. The area of the shaded region is 0.230139 . ou may need to use the appropriate technology to answer this question. or each group are also provided. Managers want to use these data to test the hypothesis that the mean examination score is the same for all three plants. State the null and alternative hypotheses. H0:1=2=3 Ha : Not all the population means are equal. H0:1=2=3Ha:1=2=3 H0 : Not all the population means are equal. Ha:1=2=3 H0 : At least two of the population means are equal. Ha : At least two of the population means are different. H0:1=2=3Ha:1=2=3 Find the value of the test statistic. (Round your answer to two decimal places.) Find the p-value. (Round your answer to four decimal places.) p-value = State your conclusion
Step by Step Solution
There are 3 Steps involved in it
Step: 1

Get Instant Access to Expert-Tailored Solutions
See step-by-step solutions with expert insights and AI powered tools for academic success
Step: 2

Step: 3

Ace Your Homework with AI
Get the answers you need in no time with our AI-driven, step-by-step assistance
Get Started


