

Answered step by step
Verified Expert Solution
Question
1 Approved Answer
1. Do you see anything different in your graph? Can you explain your graph in terms of seasons, temperature, and gas solubility in water? AutoSave
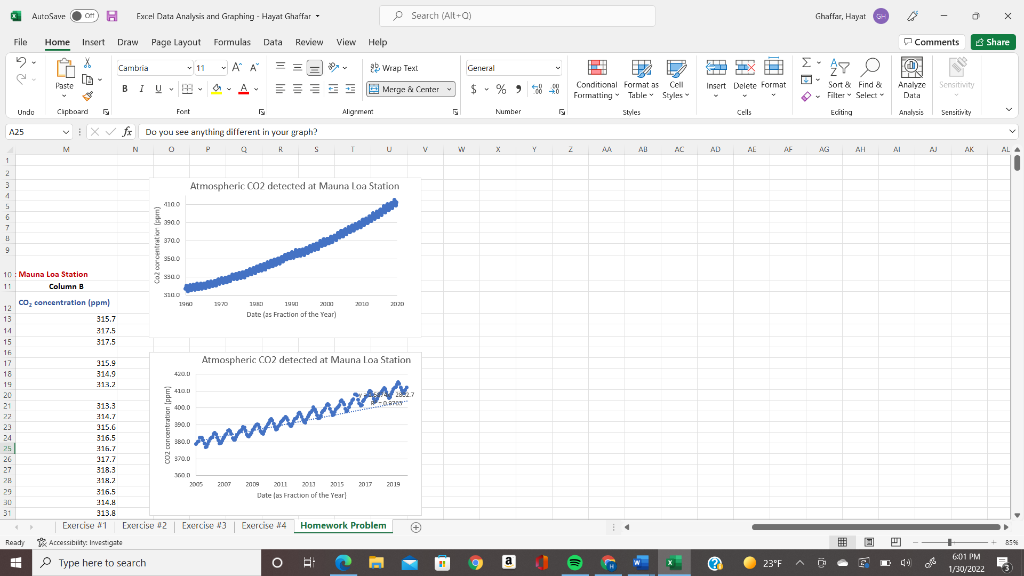
1. Do you see anything different in your graph? Can you explain your graph in terms of seasons, temperature, and gas solubility in water?
AutoSave OM Excel Data Analysis and Graphing - Hayat Ghaffar Search (Alt+a) Ghaffar, Hayat File Home Insert Draw Page Layout Formulas Data Reviow View Help Comments Share 2 X 11 W Cambria ~ A A 26 Wrap Text BA General ITX Paste BI U PA IDA Conditional Format as Cell Formatting Table Styles A $ % +388 Merge Center Insert Delete Format 0 @ Sort & Find & Analyze Filter Select Data Editing Analysis Sensitivity Unda Clipboard Font S Alignment Number Styles Sensitivity A25 . Do you see anything different in your graph? M N O R S I U V v W Y 2 2 AA AD AC AD AL AF AH AI AJ AK AL A 1 2 3 Atmospheric CO2 detected at Mauna Loa Station 1 5 4100 6 100 7 3700 9 3500 10 Mauna Loa Station S9900 11 Column 00 CO2 concentration (ppm) 1900 1970 1990 12 2010 201201 13 Date (as Fraction of the Year) 315.7 14 317.5 15 317.5 16 17 315.9 Atmospheric CO2 detected at Mauna Loa Station 18 314.9 420.0 19 213.2 20 410.00 21 313.3 400.0 22 214.7 23 915.6 290.0 24 316.5 25 360.0 216.7 20 317.7 8 370.0 27 318.3 28 218.2 2007 29 2011 2011 2015 2017 2019 2n 316.5 30 Dates Fraction of the Year 314.8 31 313.8 Exercise 41 Exercise 02 Exercise 13 Exercise 14 Homework Problem + Read Accessibility Investigate M 359 Type here to search O o 11 a ) x (2 23F (301 PM 1/30/2022Step by Step Solution
There are 3 Steps involved in it
Step: 1

Get Instant Access to Expert-Tailored Solutions
See step-by-step solutions with expert insights and AI powered tools for academic success
Step: 2

Step: 3
Ace Your Homework with AI
Get the answers you need in no time with our AI-driven, step-by-step assistance
Get Started
Organic Chemistry A Short Course
Authors: Harold Hart, Christopher M. Hadad, Leslie E. Craine, David J. Hart
13th edition
1111425566, 978-1111425562