Answered step by step
Verified Expert Solution
Question
1 Approved Answer
1. Download 10 years worth of end-of-month prices from Yahoo Finance* for the following tickers: MSFT, C, F, XOM, DUK For MSFT, you can

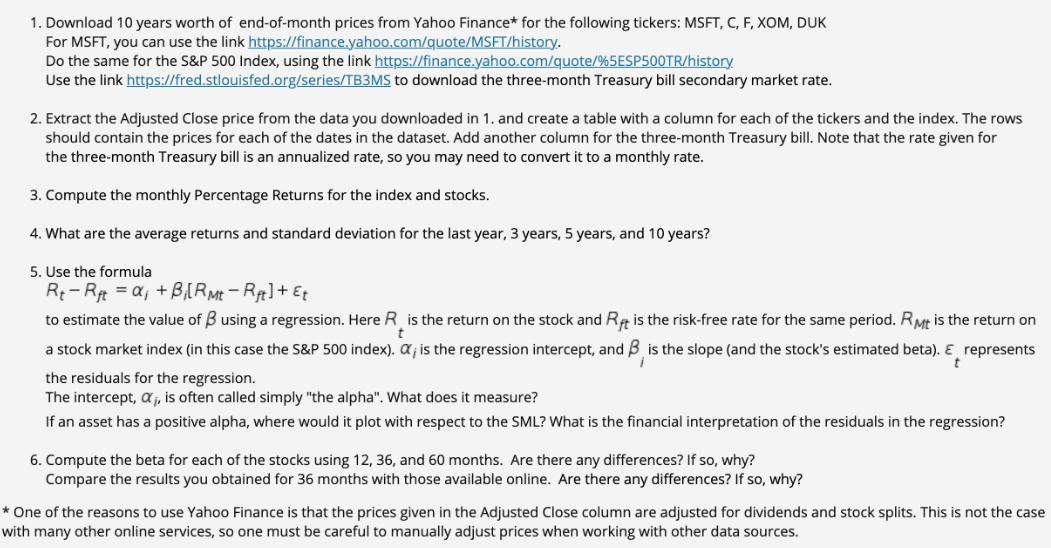
1. Download 10 years worth of end-of-month prices from Yahoo Finance* for the following tickers: MSFT, C, F, XOM, DUK For MSFT, you can use the link https://finance.yahoo.com/quote/MSFT/history. Do the same for the S&P 500 Index, using the link https://finance.yahoo.com/quote/%5ESP500TR/history. Use the link https://fred.stlouisfed.org/series/TB3MS to download the three-month Treasury bill secondary market rate. 2. Extract the Adjusted Close price from the data you downloaded in 1. and create a table with a column for each of the tickers and the index. The rows should contain the prices for each of the dates in the dataset. Add another column for the three-month Treasury bill. Note that the rate given for the three-month Treasury bill is an annualized rate, so you may need to convert it to a monthly rate. 3. Compute the monthly Percentage Returns for the index and stocks. 4. What are the average returns and standard deviation for the last year, 3 years, 5 years, and 10 years? 5. Use the formula Rt-Rft = a +B[RMt-Rft] + Et to estimate the value of 3 using a regression. Here R is the return on the stock and R is the risk-free rate for the same period. RMt is the return on t a stock market index (in this case the S&P 500 index). ; is the regression intercept, and B is the slope (and the stock's estimated beta). E represents the residuals for the regression. t The intercept, X, is often called simply "the alpha". What does it measure? If an asset has a positive alpha, where would it plot with respect to the SML? What is the financial interpretation of the residuals in the regression? 6. Compute the beta for each of the stocks using 12, 36, and 60 months. Are there any differences? If so, why? Compare the results you obtained for 36 months with those available online. Are there any differences? If so, why? * One of the reasons to use Yahoo Finance is that the prices given in the Adjusted Close column are adjusted for dividends and stock splits. This is not the case with many other online services, so one must be careful to manually adjust prices when working with other data sources.
Step by Step Solution
★★★★★
3.29 Rating (167 Votes )
There are 3 Steps involved in it
Step: 1
To solve the problem we will follow the steps outlined in the question Since I cannot actually download or access data directly I will describe the pr...
Get Instant Access to Expert-Tailored Solutions
See step-by-step solutions with expert insights and AI powered tools for academic success
Step: 2

Step: 3

Ace Your Homework with AI
Get the answers you need in no time with our AI-driven, step-by-step assistance
Get Started


