Answered step by step
Verified Expert Solution
Question
1 Approved Answer
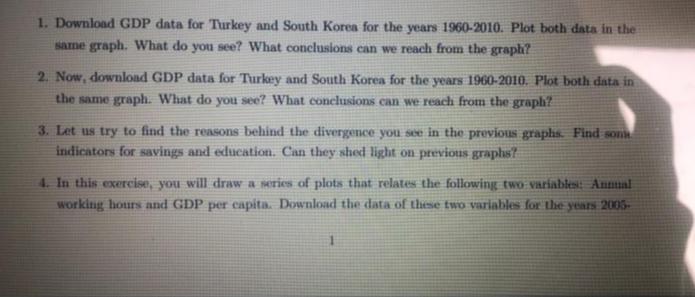
1. Download GDP data for Turkey and South Korea for the years 1960-2010. Plot both data in the same graph. What do you see?

1. Download GDP data for Turkey and South Korea for the years 1960-2010. Plot both data in the same graph. What do you see? What conclusions can we reach from the graph? 2. Now, download GDP data for Turkey and South Korea for the years 1960-2010. Plot both data in the same graph. What do you see? What conclusions can we reach from the graph? 3. Let us try to find the reasons behind the divergence you see in the previous graphs. Find son indicators for savings and education. Can they shed light on previous graphs? 4. In this exercise, you will draw a series of plots that relates the following two variables: Annual working hours and GDP per capita. Download the data of these two variables for the years 2005-
Step by Step Solution
★★★★★
3.60 Rating (161 Votes )
There are 3 Steps involved in it
Step: 1
1 Download GDP data for Turkey and South Korea for the years 19602010 and plot both data in the same graph import pandas as pd import matplotlibpyplot ...
Get Instant Access to Expert-Tailored Solutions
See step-by-step solutions with expert insights and AI powered tools for academic success
Step: 2

Step: 3

Ace Your Homework with AI
Get the answers you need in no time with our AI-driven, step-by-step assistance
Get Started


