

Answered step by step
Verified Expert Solution
Question
1 Approved Answer
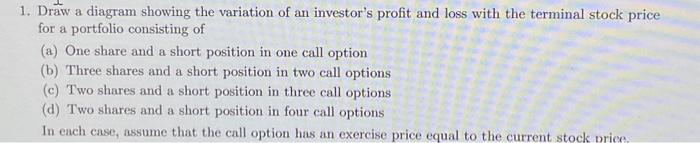
1. Draw a diagram showing the variation of an investor's profit and loss with the terminal stock price for a portfolio consisting of (a) One
Step by Step Solution
There are 3 Steps involved in it
Step: 1

Get Instant Access to Expert-Tailored Solutions
See step-by-step solutions with expert insights and AI powered tools for academic success
Step: 2

Step: 3
Ace Your Homework with AI
Get the answers you need in no time with our AI-driven, step-by-step assistance
Get Started
Technical Analysis Of Stock Trends
Authors: Robert D. Edwards, John Magee , W.H.C. Bassetti
11th Edition
1138069418,1351631438