Answered step by step
Verified Expert Solution
Link Copied!

Question

1 Approved Answer

1) Draw the cash flow diagram for the following estimate Cost/Revenue Estimates: Investment BD 50,000 Revenue for every 3 years -BD 20,000 Annual Operating Costs-

image text in transcribed
1) Draw the cash flow diagram for the following estimate Cost/Revenue Estimates: Investment BD 50,000 Revenue for every 3 years -BD 20,000 Annual Operating Costs- BD 2,500 Maintenance cost for every 2 years- BD 250 Salvage Value @ EOY 8 - BD 10,000 Study Period 8 years. 2) If P= BD 2500, i= 4% N= 4 years and 18 months find Interest amount I and find the future amount of money F

Step by Step Solution

There are 3 Steps involved in it

Step: 1

blur-text-image

Get Instant Access to Expert-Tailored Solutions

See step-by-step solutions with expert insights and AI powered tools for academic success

Step: 2

blur-text-image

Step: 3

blur-text-image

Ace Your Homework with AI

Get the answers you need in no time with our AI-driven, step-by-step assistance

Get Started

Recommended Textbook for

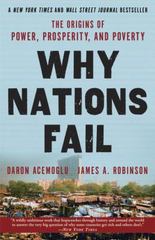
Why Nations Fail The Origins Of Power, Prosperity, And Poverty

Authors: Daron Acemoglu, James Robinson

1st Edition

0307719227, 9780307719225

More Books

Students also viewed these Economics questions

Question

Are the hours flexible or set?

Answered: 1 week ago