

Question: 1 Drop a ruler between your partners hand to find out who has the fastest reaction time Your drop distance (cm) 9 4 12 3
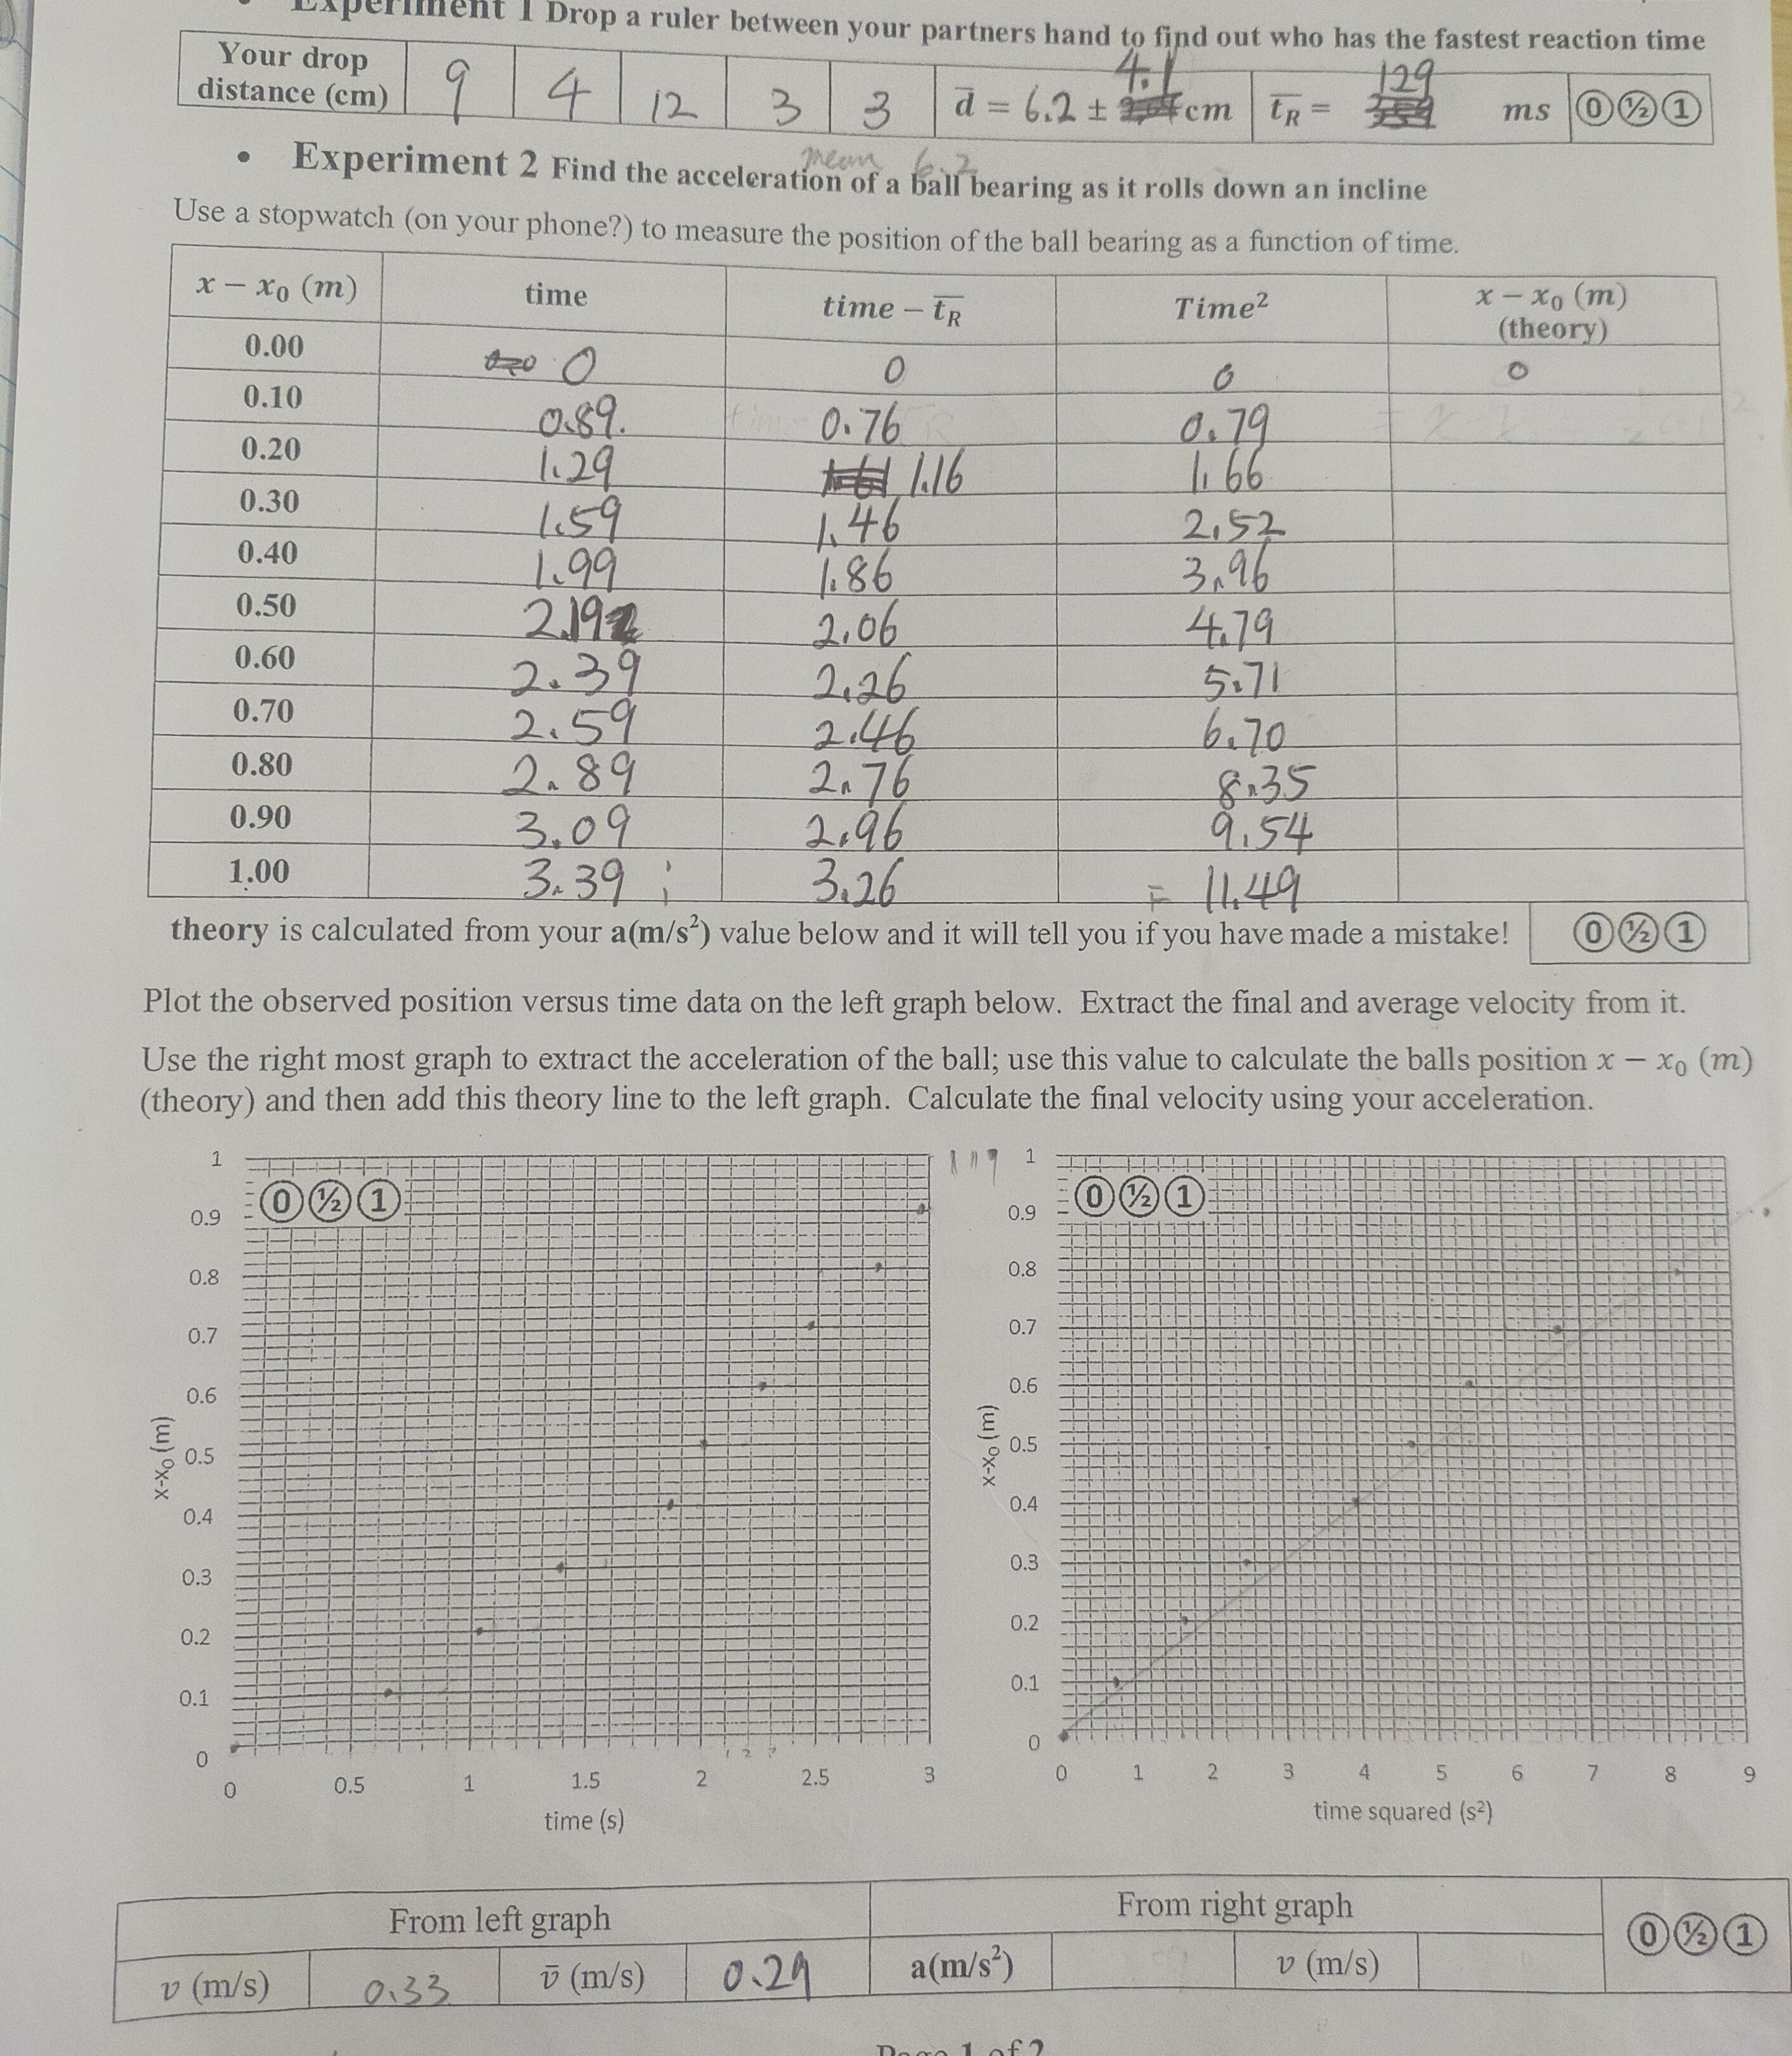
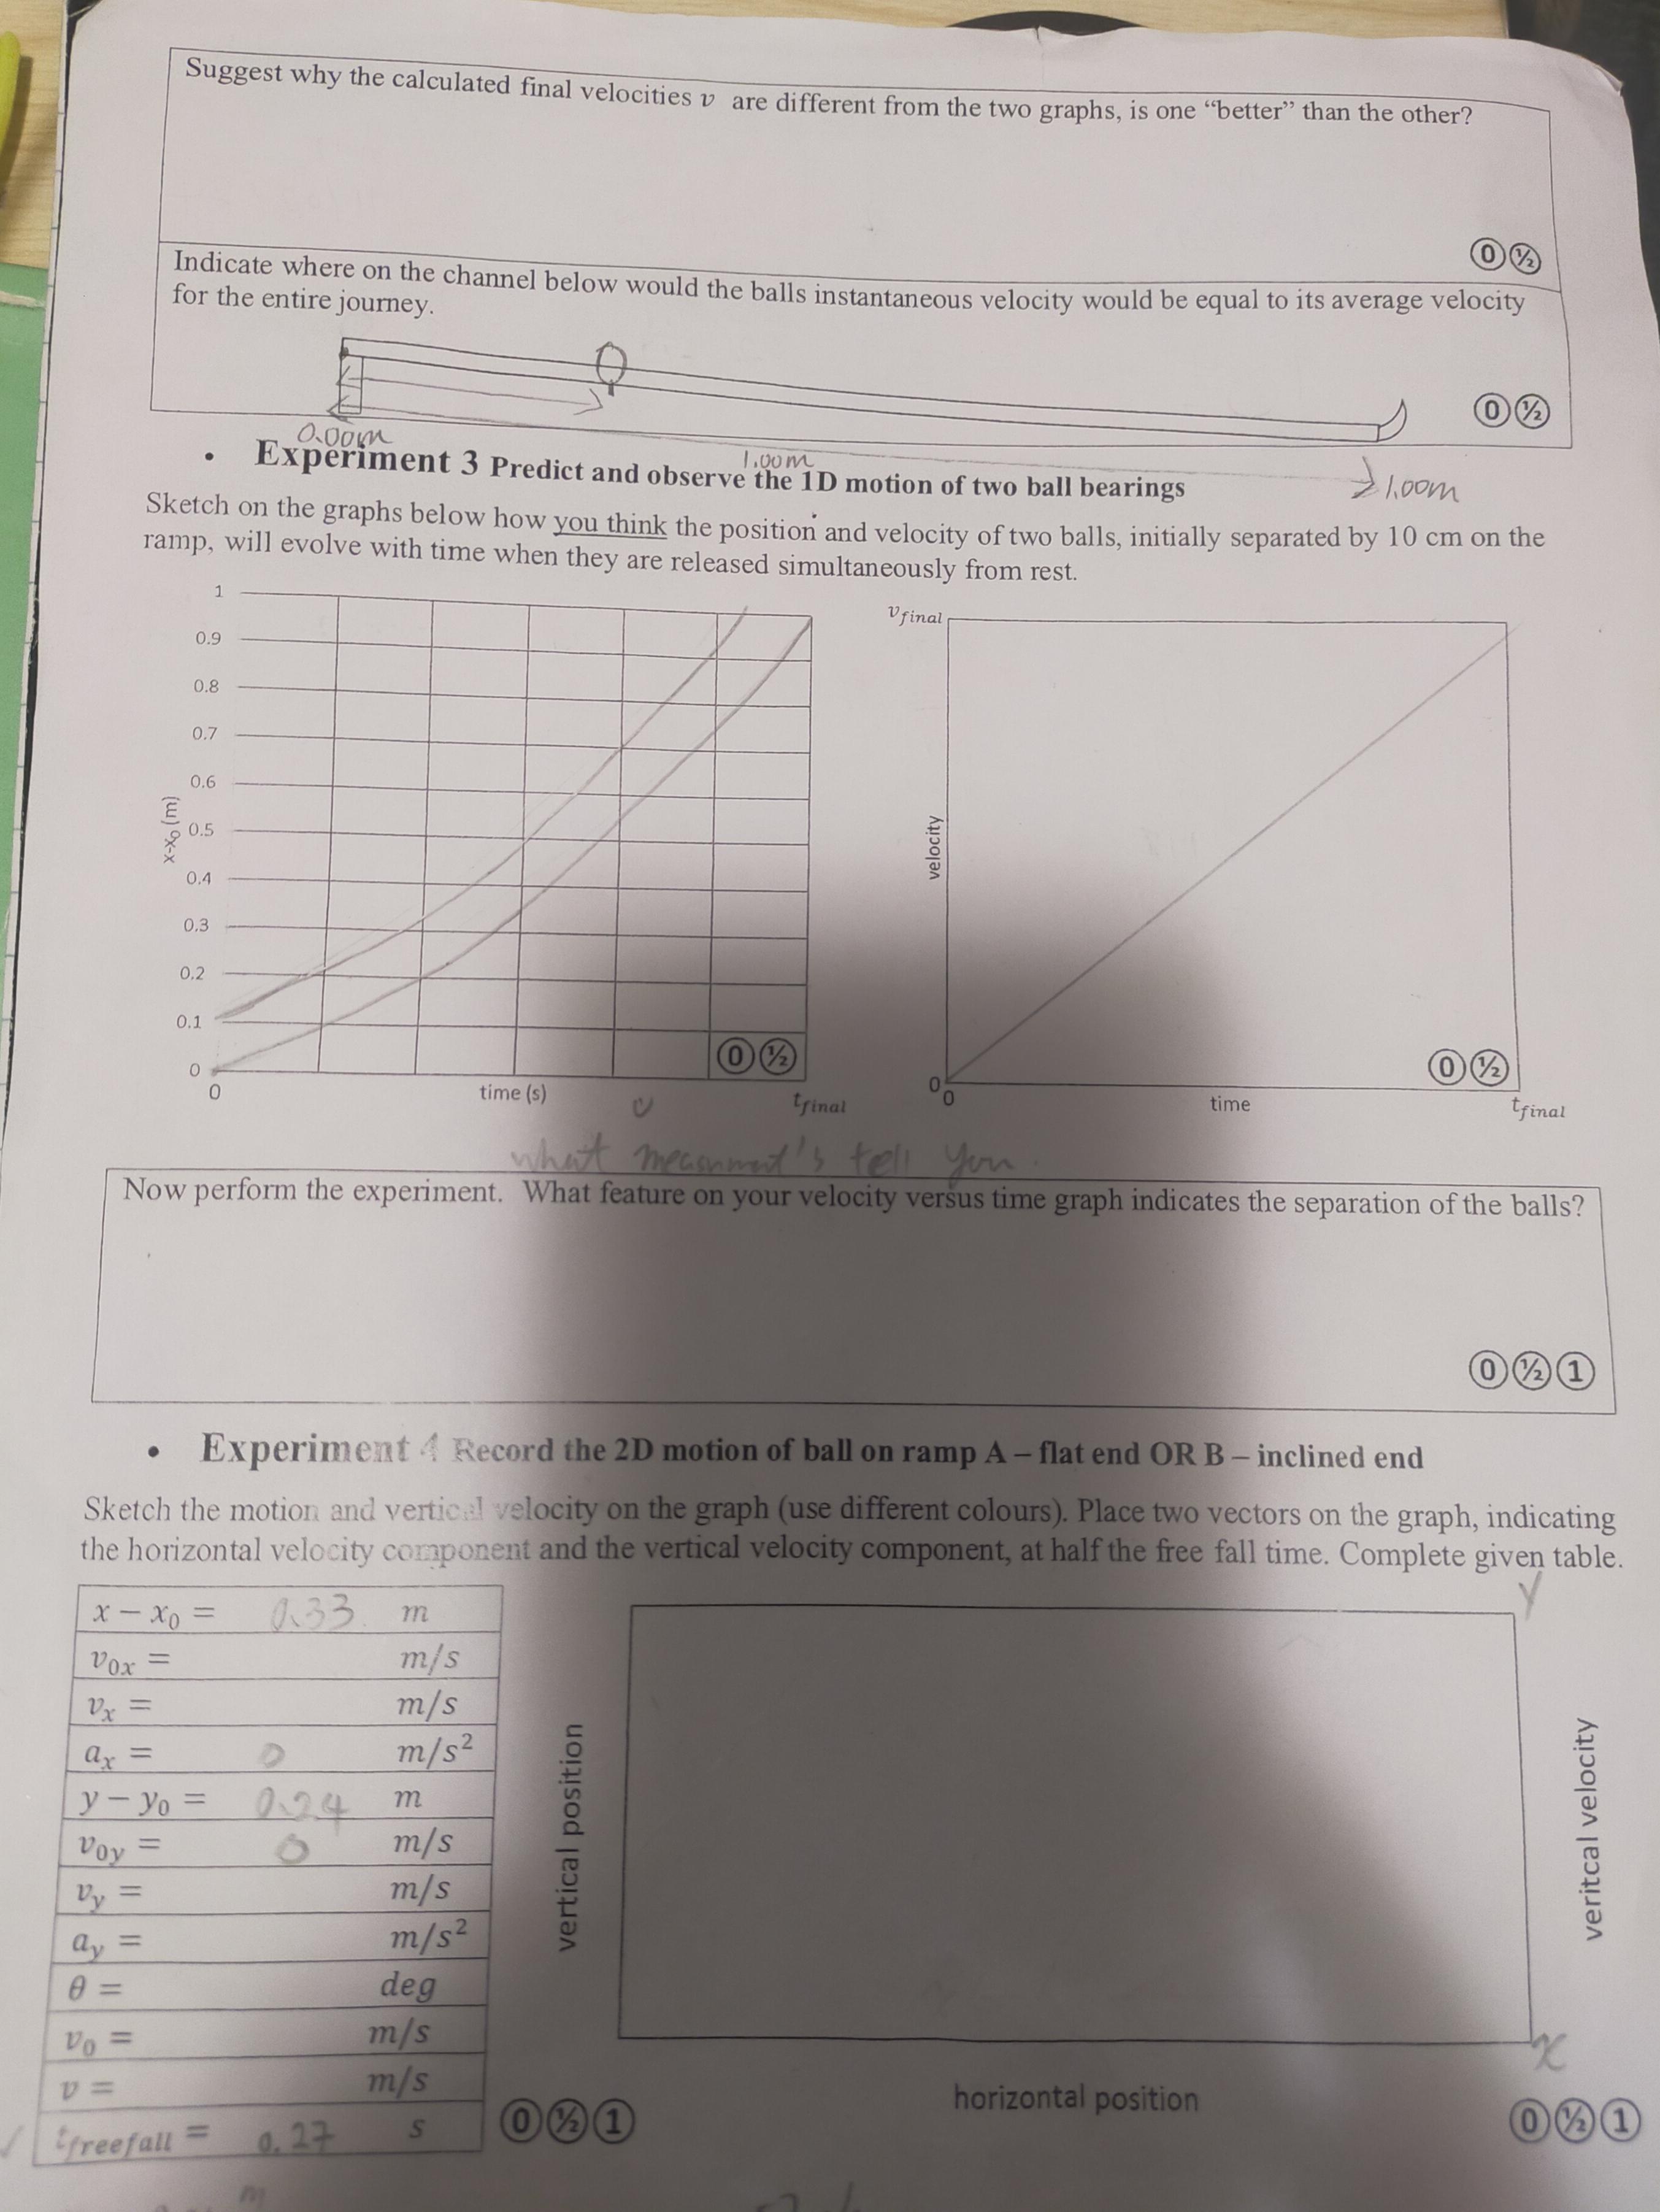
1 Drop a ruler between your partners hand to find out who has the fastest reaction time Your drop distance (cm) 9 4 12 3 3 2 = 6 . 2 + 20cm 4. 129 ER = ms 1 1/2 1 Experiment 2 Find the acceleration of a ball bearing as it rolls down an incline Use a stopwatch (on your phone?) to measure the position of the ball bearing as a function of time. x - xo (m) time time - tR Time x - Xo (m) 0.00 (theory) 0.10 089 0. 76 0.20 0. 79 1.29 1 1.16 11 66 0.30 159 146 2152 0.40 1.99 1.86 3. 96 0.50 219 % 2, 06 4.79 0.60 2.39 2.26 5:71 0.70 2.59 2.46 6.70 0.80 2.89 2 n 76 8135 0.90 3.09 2: 96 9, 54 1.00 3.39 3.26 14.49 theory is calculated from your a(m/s ) value below and it will tell you if you have made a mistake! Plot the observed position versus time data on the left graph below. Extract the final and average velocity from it. Use the right most graph to extract the acceleration of the ball; use this value to calculate the balls position x - xo (m) (theory) and then add this theory line to the left graph. Calculate the final velocity using your acceleration. 11 9 1 THAT 0.9 :0 1/2 1 0.9 :0 12 1 0.8 0.8 0.7 0.7 0.6 0.6 E E 0 .5 0.5 0.4 0.4 0 .3 0.3 0.2 0 . 2 0.1 0.1 0 0.5 1 1.5 2 2.5 3 10 1 2 3 5 8 9 time (s) time squared (s=) From left graph From right graph v (m/s) 0:33 v ( m/s ) 10.29 a(m/s) v (m/s)Suggest why the calculated final velocities v are different from the two graphs, is one "better" than the other? for the entire journey. Indicate where on the channel below would the balls instantaneous velocity would be equal to its average velocity Experiment 3 Predict and observe the 1D motion of two ball bearings Sketch on the graphs below how you think the position and velocity of two balls, initially separated by 10 cm on the ramp, will evolve with time when they are released simultaneously from rest. Vfinal 0.9 0.8 0.7 0.6 E 9 0.5 velocity 0.4 0.3 0 .2 0.1 0 0 1/2 1 1/2 time ( s ) trinal time final what meanments tell you Now perform the experiment. What feature on your velocity versus time graph indicates the separation of the balls? . Experiment 4 Record the 2D motion of ball on ramp A - flat end OR B - inclined end Sketch the motion and vertical velocity on the graph (use different colours). Place two vectors on the graph, indicating the horizontal velocity component and the vertical velocity component, at half the free fall time. Complete given table. x - XO = 133 m Vox = m/s VX = m/s ax = m/s2 y - yo = 0 24 m veritcal velocity VOY = m/s vertical position Vy = m/s ay = m/s2 0 = deg Vo = m/s D = m/s horizontal position "freefall = 0. 23 S
Step by Step Solution
There are 3 Steps involved in it

Get step-by-step solutions from verified subject matter experts