

Answered step by step
Verified Expert Solution
Question
1 Approved Answer
1. Economic Growth: For parts (a)-(c): Consider the following data on China from the International Monetary Fund (IMF): Year 2010 RGDP (in US $
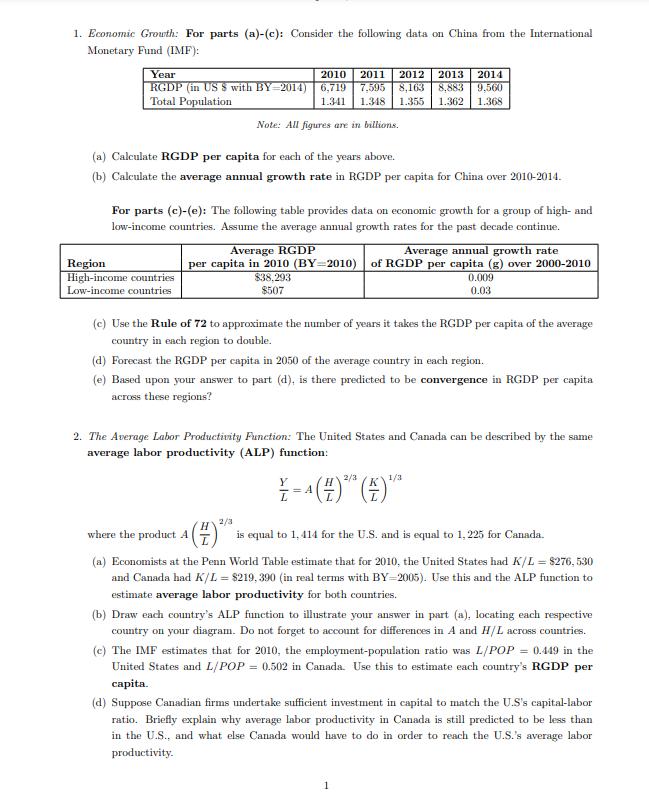
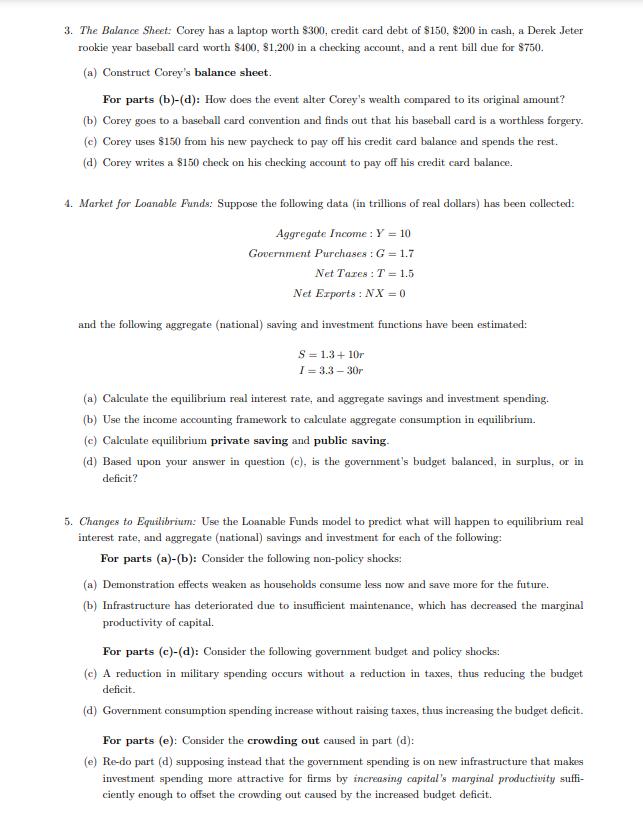
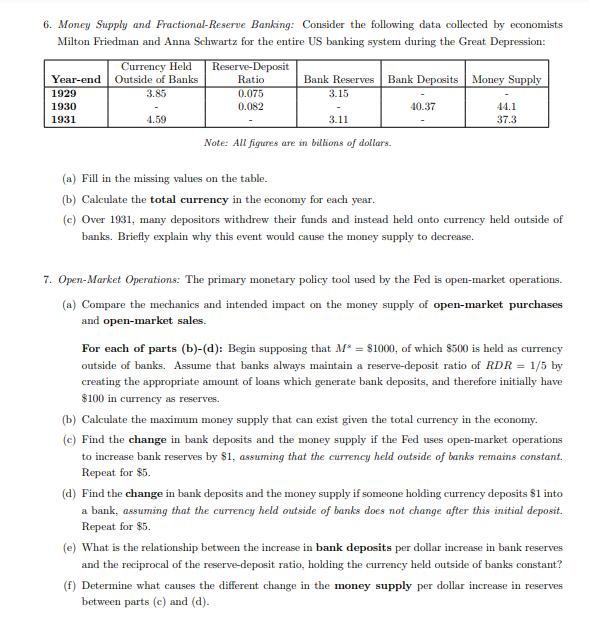
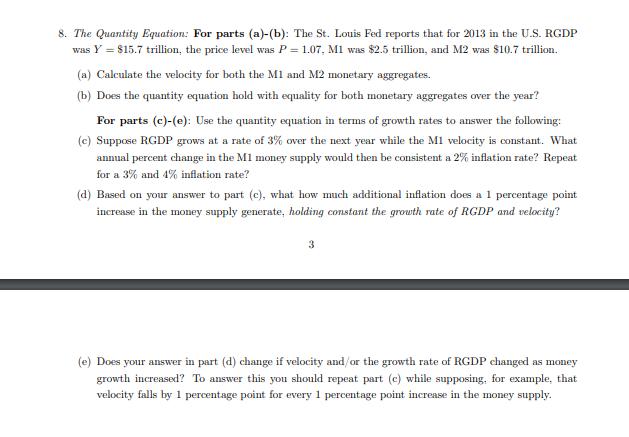
1. Economic Growth: For parts (a)-(c): Consider the following data on China from the International Monetary Fund (IMF): Year 2010 RGDP (in US $ with BY 2014) 6,719 Total Population 2011 2012 2013 2014 7,595 8,163 8,883 9,560 1.341 1.348 1.355 1.362 1.368 Note: All figures are in billions. (a) Calculate RGDP per capita for each of the years above. (b) Calculate the average annual growth rate in RGDP per capita for China over 2010-2014. Region High-income countries Low-income countries For parts (c)-(e): The following table provides data on economic growth for a group of high- and low-income countries. Assume the average annual growth rates for the past decade continue. Average RGDP Average annual growth rate per capita in 2010 (BY=2010) of RGDP per capita (g) over 2000-2010 $38.293 8507 0.009 0.03 (c) Use the Rule of 72 to approximate the number of years it takes the RGDP per capita of the average country in each region to double. (d) Forecast the RGDP per capita in 2050 of the average country in each region. (e) Based upon your answer to part (d), is there predicted to be convergence in RGDP per capita across these regions? 2. The Average Labor Productivity Function: The United States and Canada can be described by the same average labor productivity (ALP) function: 2/3 1/3 Y = (2) ** ()* A 2/3 H where the product 4 () is equal to 1,414 for the U.S. and is equal to 1,225 for Canada. (a) Economists at the Penn World Table estimate that for 2010, the United States had K/L = $276, 530 and Canada had K/L = $219, 390 (in real terms with BY-2005). Use this and the ALP function to estimate average labor productivity for both countries. (b) Draw each country's ALP function to illustrate your answer in part (a), locating each respective country on your diagram. Do not forget to account for differences in A and H/L across countries. (e) The IMF estimates that for 2010, the employment-population ratio was L/POP = 0.449 in the United States and L/POP = 0.502 in Canada. Use this to estimate each country's RGDP per capita. (d) Suppose Canadian firms undertake sufficient investment in capital to match the U.S's capital-labor ratio. Briefly explain why average labor productivity in Canada is still predicted to be less than in the U.S., and what else Canada would have to do in order to reach the U.S.'s average labor productivity. 3. The Balance Sheet: Corey has a laptop worth $300, credit card debt of $150, $200 in cash, a Derek Jeter rookie year baseball card worth $400, $1,200 in a checking account, and a rent bill due for $750. (a) Construct Corey's balance sheet. For parts (b)-(d): How does the event alter Corey's wealth compared to its original amount? (b) Corey goes to a baseball card convention and finds out that his baseball card is a worthless forgery. (e) Corey uses $150 from his new paycheck to pay off his credit card balance and spends the rest. (d) Corey writes a $150 check on his checking account to pay off his credit card balance. 4. Market for Loanable Funds: Suppose the following data (in trillions of real dollars) has been collected: Aggregate Income: Y = 10 Government Purchases: G = 1.7 Net Tazes : T = 1.5 Net Exports: NX=0 and the following aggregate (national) saving and investment functions have been estimated: S = 1.3 + 10r I=3.3-30r (a) Calculate the equilibrium real interest rate, and aggregate savings and investment spending. (b) Use the income accounting framework to calculate aggregate consumption in equilibrium. (c) Calculate equilibrium private saving and public saving. (d) Based upon your answer in question (c), is the government's budget balanced, in surplus, or in deficit? 5. Changes to Equilibrium: Use the Loanable Funds model to predict what will happen to equilibrium real interest rate, and aggregate (national) savings and investment for each of the following: For parts (a)-(b): Consider the following non-policy shocks: (a) Demonstration effects weaken as households consume less now and save more for the future. (b) Infrastructure has deteriorated due to insufficient maintenance, which has decreased the marginal productivity of capital. For parts (c)-(d): Consider the following government budget and policy shocks: (e) A reduction in military spending occurs without a reduction in taxes, thus reducing the budget deficit. (d) Government consumption spending increase without raising taxes, thus increasing the budget deficit. For parts (e): Consider the crowding out caused in part (d): (e) Re-do part (d) supposing instead that the government spending is on new infrastructure that makes investment spending more attractive for firms by increasing capital's marginal productivity suffi- ciently enough to offset the crowding out caused by the increased budget deficit. 6. Money Supply and Fractional-Reserve Banking: Consider the following data collected by economists Milton Friedman and Anna Schwartz for the entire US banking system during the Great Depression: Currency Held Year-end Outside of Banks 3.85 4.59 1929 1930 1931 Reserve-Deposit Ratio 0.075 0.082 Bank Reserves Bank Deposits Money Supply 3.15 3.11 Note: All figures are in billions of dollars. 40.37 44.1 37.3 (a) Fill in the missing values on the table. (b) Calculate the total currency in the economy for each year. (c) Over 1931, many depositors withdrew their funds and instead held onto currency held outside of banks. Briefly explain why this event would cause the money supply to decrease. 7. Open-Market Operations: The primary monetary policy tool used by the Fed is open-market operations. (a) Compare the mechanics and intended impact on the money supply of open-market purchases and open-market sales. For each of parts (b)-(d): Begin supposing that M = $1000, of which $500 is held as currency outside of banks. Assume that banks always maintain a reserve-deposit ratio of RDR = 1/5 by creating the appropriate amount of loans which generate bank deposits, and therefore initially have $100 in currency as reserves. (b) Calculate the maximum money supply that can exist given the total currency in the economy. (e) Find the change in bank deposits and the money supply if the Fed uses open-market operations to increase bank reserves by $1, assuming that the currency held outside of banks remains constant. Repeat for $5. (d) Find the change in bank deposits and the money supply if someone holding currency deposits 81 into a bank, assuming that the currency held outside of banks does not change after this initial deposit. Repeat for $5. (e) What is the relationship between the increase in bank deposits per dollar increase in bank reserves and the reciprocal of the reserve-deposit ratio, holding the currency held outside of banks constant? (f) Determine what causes the different change in the money supply per dollar increase in reserves between parts (c) and (d). 8. The Quantity Equation: For parts (a)-(b): The St. Louis Fed reports that for 2013 in the U.S. RGDP was Y = $15.7 trillion, the price level was P = 1.07, M1 was $2.5 trillion, and M2 was $10.7 trillion. (a) Calculate the velocity for both the M1 and M2 monetary aggregates. (b) Does the quantity equation hold with equality for both monetary aggregates over the year? For parts (c)-(e): Use the quantity equation in terms of growth rates to answer the following: (c) Suppose RGDP grows at a rate of 3% over the next year while the M1 velocity is constant. What annual percent change in the M1 money supply would then be consistent a 2% inflation rate? Repeat for a 3% and 4% inflation rate? (d) Based on your answer to part (c), what how much additional inflation does a 1 percentage point increase in the money supply generate, holding constant the growth rate of RGDP and velocity? 3 (e) Does your answer in part (d) change if velocity and/or the growth rate of RGDP changed as money growth increased? To answer this you should repeat part (e) while supposing, for example, that velocity falls by 1 percentage point for every 1 percentage point increase in the money supply.
Step by Step Solution
★★★★★
3.49 Rating (156 Votes )
There are 3 Steps involved in it
Step: 1
Economic Growth a To calculate RGDP per capita for each year we need to divide the total RGDP by the total population RGDP per capita in 2010 6719 1341 billion 5062 RGDP per capita in 2011 7595 1348 b...
Get Instant Access to Expert-Tailored Solutions
See step-by-step solutions with expert insights and AI powered tools for academic success
Step: 2

Step: 3
Ace Your Homework with AI
Get the answers you need in no time with our AI-driven, step-by-step assistance
Get Started
International Business And The New Realities
Authors: S. Tamer Cavusgil, Gary Knight, John R. Riesenberger
2nd Edition
9780131738607, 131738607, 978-0136090984