Answered step by step
Verified Expert Solution
Question
1 Approved Answer
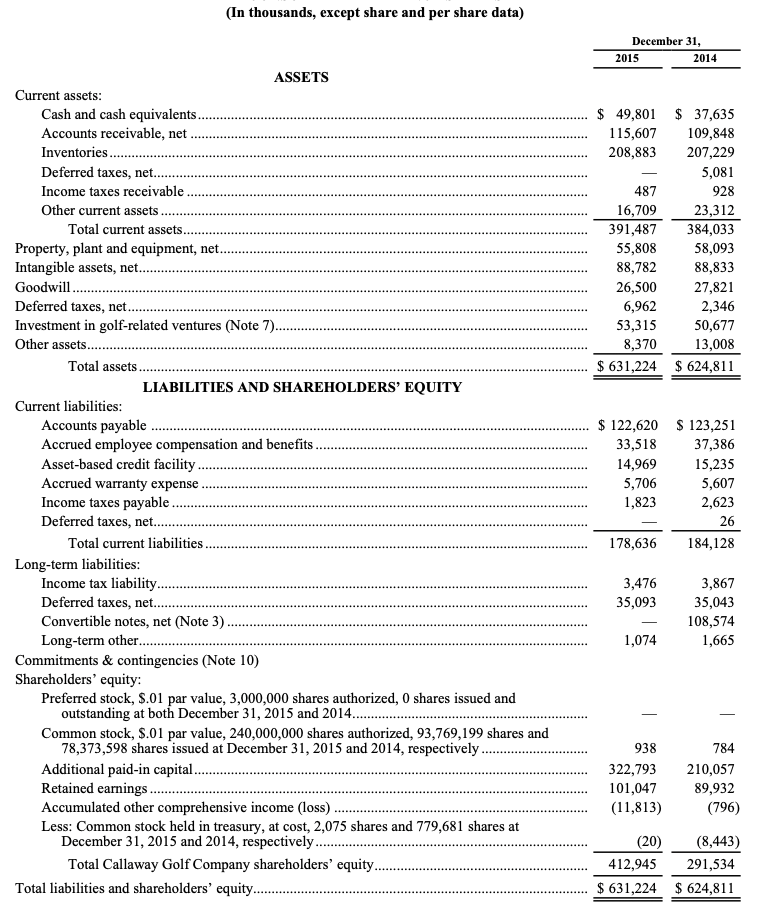
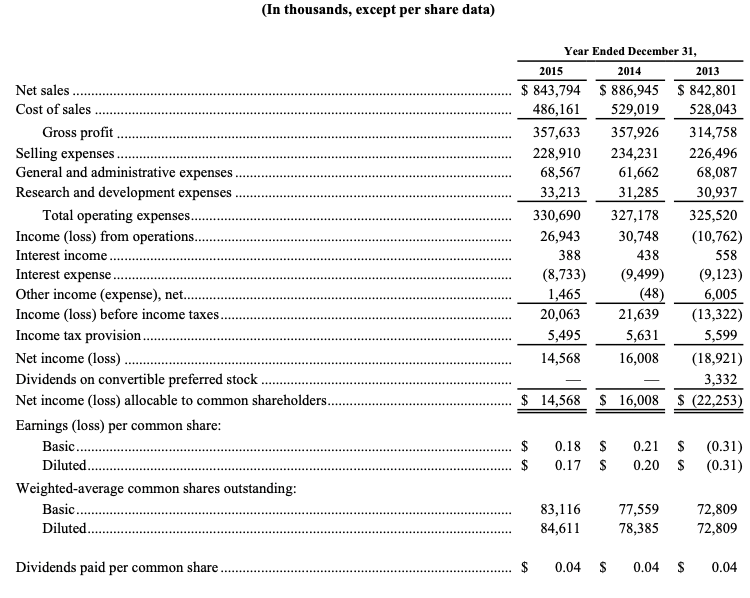
1. Estimate how much cash callaway collected from its customers in 2015(NOTE: does not have any deferred revenue as it doesn't allow customers to pay


1. Estimate how much cash callaway collected from its customers in 2015(NOTE: does not have any deferred revenue as it doesn't allow customers to pay before delivery)
2. If Calloway had 20,000 more amortization expense than it had in 2015, how would its net income change?
3. In 2015, Callaway recognized and paid 33,313 in research and development expenses. Callaway did all of the research internally. Which section of the statement of cashflows is affected by these expenditures?
(In thousands, except share and per share data) December 31, 2015 2014 $ 49,801 $ 37,635 115,607 109,848 208,883 207,229 5,081 487 928 16,709 23,312 391,487 384,033 55,808 58,093 88,782 88,833 26,500 27,821 6,962 2,346 53,315 50,677 8,370 13,008 $631,224 $ 624,811 ASSETS Current assets: Cash and cash equivalents... Accounts receivable, net .. Inventories.. Deferred taxes, net.. Income taxes receivable. Other current assets Total current assets.. Property, plant and equipment, net. Intangible assets, net..... Goodwill.. Deferred taxes, net.. Investment in golf-related ventures (Note 7).. Other assets....... Total assets.. LIABILITIES AND SHAREHOLDERS' EQUITY Current liabilities: Accounts payable Accrued employee compensation and benefits. Asset-based credit facility Accrued warranty expense. Income taxes payable. Deferred taxes, net... Total current liabilities. Long-term liabilities: Income tax liability.. Deferred taxes, net..... Convertible notes, net (Note 3). Long-term other........ Commitments & contingencies (Note 10) Shareholders' equity: Preferred stock, $.01 par value, 3,000,000 shares authorized, 0 shares issued and outstanding at both December 31, 2015 and 2014.... Common stock, $.01 par value, 240,000,000 shares authorized, 93,769,199 shares and 78,373,598 shares issued at December 31, 2015 and 2014, respectively Additional paid-in capital........ Retained earnings. Accumulated other comprehensive income (loss)....... Less: Common stock held in treasury, at cost, 2,075 shares and 779,681 shares at December 31, 2015 and 2014, respectively.. Total Callaway Golf Company shareholders' equity.. Total liabilities and shareholders' equity............... $ 122,620 $ 123,251 33,518 37,386 14,969 15,235 5,706 5,607 1,823 2,623 26 178,636 184,128 3,476 35,093 3,867 35,043 108,574 1,665 1,074 938 322,793 101,047 (11,813) 784 210,057 89,932 (796) (20) (8,443) 412,945 291,534 $631,224 $ 624,811 (In thousands, except per share data) Year Ended December 31, Net sales. Cost of sales Gross profit. Selling expenses. General and administrative expenses. Research and development expenses Total operating expenses. Income (loss) from operations... Interest income Interest expense.. Other income (expense), net.. Income (loss) before income taxes. Income tax provision...... Net income (loss). Dividends on convertible preferred stock. Net income (loss) allocable to common shareholders. Earnings (loss) per common share: Basic..... Diluted... Weighted-average common shares outstanding: Basic. Diluted. 2015 2014 2013 $ 843,794 $ 886,945 $ 842,801 486,161 529,019 528,043 357,633 357,926 314,758 228,910 234,231 226,496 68,567 61,662 68,087 33,213 31,285 30,937 330,690 327,178 325,520 26,943 30,748 (10,762) 388 438 558 (8,733) (9,499) (9,123) 1,465 (48) 6,005 20,063 21,639 (13,322) 5,495 5,631 5,599 14,568 16,008 (18,921) 3,332 $ 14,568 $ 16,008 S (22,253) $ $ 0.18 $ 0.17 $ 0.21 $ 0.20 $ (0.31) (0.31) 83,116 84,611 77,559 78,385 72,809 72,809 Dividends paid per common share. $ 0.04 $ 0.04 $ 0.04 (In thousands, except share and per share data) December 31, 2015 2014 $ 49,801 $ 37,635 115,607 109,848 208,883 207,229 5,081 487 928 16,709 23,312 391,487 384,033 55,808 58,093 88,782 88,833 26,500 27,821 6,962 2,346 53,315 50,677 8,370 13,008 $631,224 $ 624,811 ASSETS Current assets: Cash and cash equivalents... Accounts receivable, net .. Inventories.. Deferred taxes, net.. Income taxes receivable. Other current assets Total current assets.. Property, plant and equipment, net. Intangible assets, net..... Goodwill.. Deferred taxes, net.. Investment in golf-related ventures (Note 7).. Other assets....... Total assets.. LIABILITIES AND SHAREHOLDERS' EQUITY Current liabilities: Accounts payable Accrued employee compensation and benefits. Asset-based credit facility Accrued warranty expense. Income taxes payable. Deferred taxes, net... Total current liabilities. Long-term liabilities: Income tax liability.. Deferred taxes, net..... Convertible notes, net (Note 3). Long-term other........ Commitments & contingencies (Note 10) Shareholders' equity: Preferred stock, $.01 par value, 3,000,000 shares authorized, 0 shares issued and outstanding at both December 31, 2015 and 2014.... Common stock, $.01 par value, 240,000,000 shares authorized, 93,769,199 shares and 78,373,598 shares issued at December 31, 2015 and 2014, respectively Additional paid-in capital........ Retained earnings. Accumulated other comprehensive income (loss)....... Less: Common stock held in treasury, at cost, 2,075 shares and 779,681 shares at December 31, 2015 and 2014, respectively.. Total Callaway Golf Company shareholders' equity.. Total liabilities and shareholders' equity............... $ 122,620 $ 123,251 33,518 37,386 14,969 15,235 5,706 5,607 1,823 2,623 26 178,636 184,128 3,476 35,093 3,867 35,043 108,574 1,665 1,074 938 322,793 101,047 (11,813) 784 210,057 89,932 (796) (20) (8,443) 412,945 291,534 $631,224 $ 624,811 (In thousands, except per share data) Year Ended December 31, Net sales. Cost of sales Gross profit. Selling expenses. General and administrative expenses. Research and development expenses Total operating expenses. Income (loss) from operations... Interest income Interest expense.. Other income (expense), net.. Income (loss) before income taxes. Income tax provision...... Net income (loss). Dividends on convertible preferred stock. Net income (loss) allocable to common shareholders. Earnings (loss) per common share: Basic..... Diluted... Weighted-average common shares outstanding: Basic. Diluted. 2015 2014 2013 $ 843,794 $ 886,945 $ 842,801 486,161 529,019 528,043 357,633 357,926 314,758 228,910 234,231 226,496 68,567 61,662 68,087 33,213 31,285 30,937 330,690 327,178 325,520 26,943 30,748 (10,762) 388 438 558 (8,733) (9,499) (9,123) 1,465 (48) 6,005 20,063 21,639 (13,322) 5,495 5,631 5,599 14,568 16,008 (18,921) 3,332 $ 14,568 $ 16,008 S (22,253) $ $ 0.18 $ 0.17 $ 0.21 $ 0.20 $ (0.31) (0.31) 83,116 84,611 77,559 78,385 72,809 72,809 Dividends paid per common share. $ 0.04 $ 0.04 $ 0.04Step by Step Solution
There are 3 Steps involved in it
Step: 1

Get Instant Access to Expert-Tailored Solutions
See step-by-step solutions with expert insights and AI powered tools for academic success
Step: 2

Step: 3

Ace Your Homework with AI
Get the answers you need in no time with our AI-driven, step-by-step assistance
Get Started


