Answered step by step
Verified Expert Solution
Question
1 Approved Answer
1) Evaluate how much your company has paid in dividends over time, both in absolute terms and relative to its market value of equity and
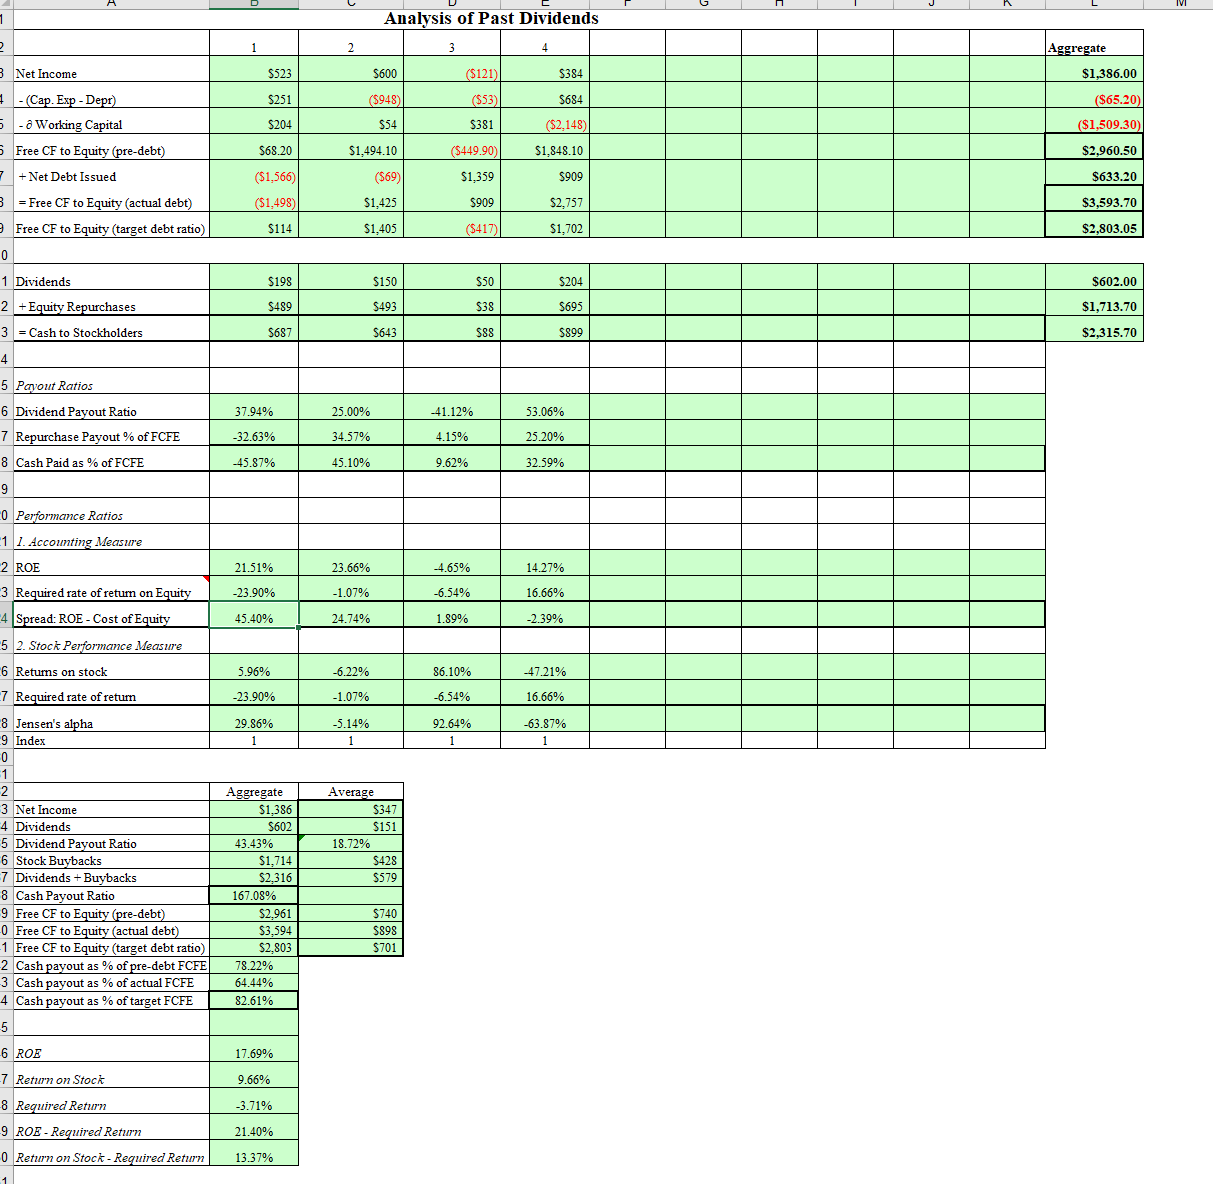
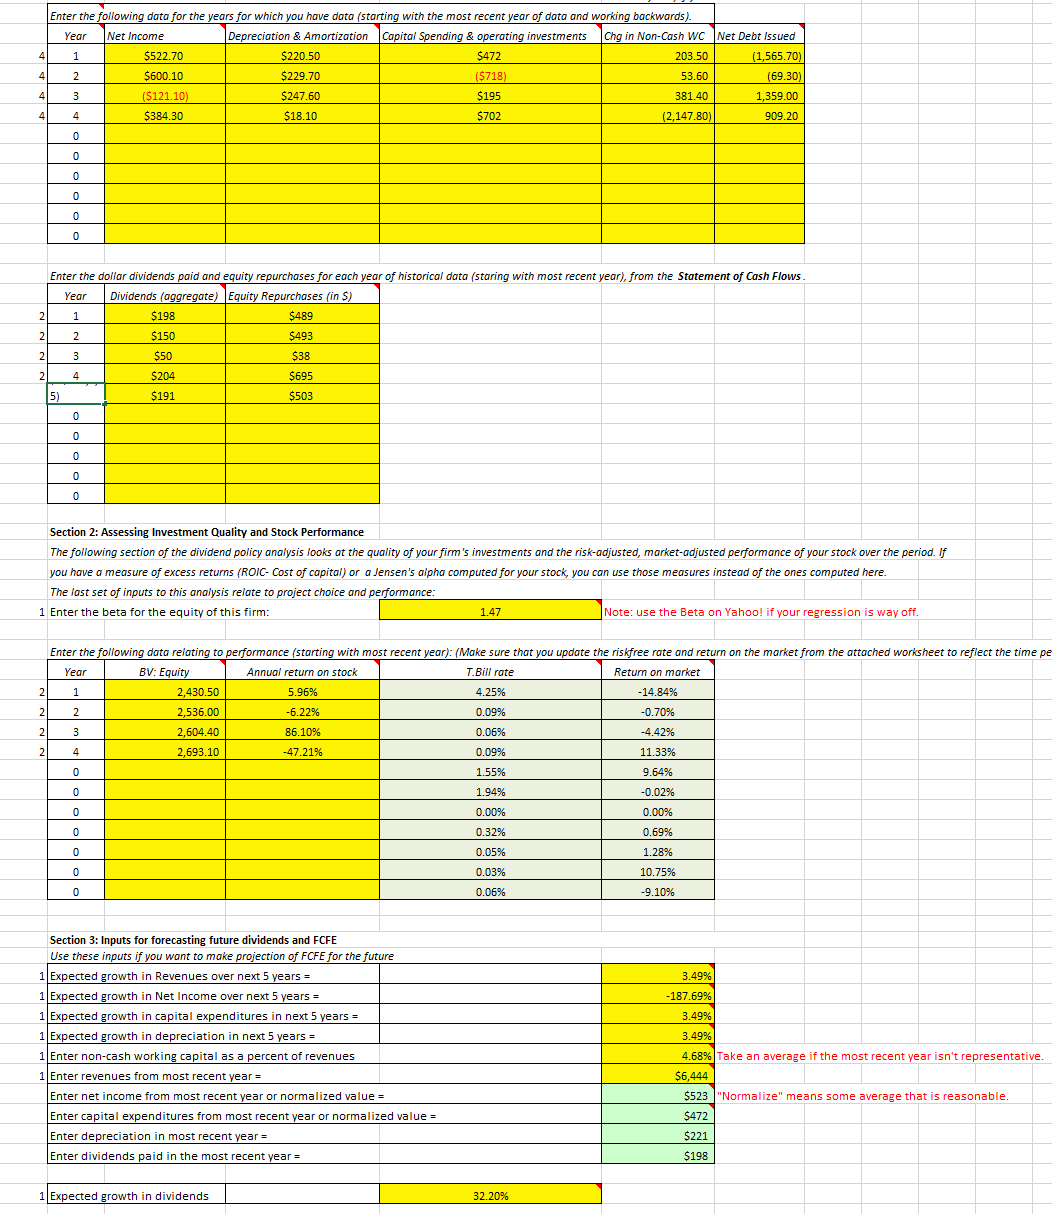
1) Evaluate how much your company has paid in dividends over time, both in absolute terms and relative to its market value of equity and net income.
2) Compare your firm's dividends to its FCFE, looking at the last 5 years of historical information. Evaluate, given the tradeoffs on dividends, whether your firm should be a high dividend paying, a low dividend paying, or a non-dividend paying firm.
year 1 - 2023
year 2 - 2022
year 3 - 2021
year 4 - 2020


1 2 B Net Income (Cap. Exp - Depr) Analysis of Past Dividends 1 2 3 4 $523 $600 ($121) $384 $251 ($948) ($53) $684 Aggregate $1,386.00 ($65.20) 5 Working Capital $204 $54 $381 ($2,148) ($1,509.30) 5 Free CF to Equity (pre-debt) $68.20 $1,494.10 ($449.90) $1,848.10 $2,960.50 7 + Net Debt Issued ($1,566) ($69) $1,359 $909 $633.20 = B Free CF to Equity (actual debt) ($1,498) $1,425 $909 $2,757 $3,593.70 Free CF to Equity (target debt ratio) $114 $1,405 ($417) $1,702 $2,803.05 0 1 Dividends $198 $150 $50 $204 $602.00 2 +Equity Repurchases $489 $493 $38 $695 $1,713.70 3 = Cash to Stockholders $687 $643 $88 $899 $2,315.70 4 5 Payout Ratios 6 Dividend Payout Ratio 37.94% 25.00% -41.12% 53.06% 7 Repurchase Payout % of FCFE -32.63% 34.57% 4.15% 25.20% 8 Cash Paid as % of FCFE -45.87% 45.10% 9.62% 32.59% 9 0 Performance Ratios 11. Accounting Measure 2 ROE 21.51% 23.66% -4.65% 14.27% 3 Required rate of return on Equity -23.90% -1.07% -6.54% 16.66% 4 Spread: ROE - Cost of Equity 45.40% 24.74% 1.89% -2.39% 5 2. Stock Performance Measure 6 Returns on stock 5.96% -6.22% 86.10% -47.21% 7 Required rate of return -23.90% -1.07% -6.54% 16.66% 8 Jensen's alpha 29.86% -5.14% 92.64% -63.87% 9 Index 1 1 1 1 0 1 2 3 Net Income 4 Dividends Aggregate $1,386 $602 Average $347 $151 5 Dividend Payout Ratio 43.43% 18.72% 6 Stock Buybacks $1,714 $428 7 Dividends + Buybacks $2,316 $579 8 Cash Payout Ratio 167.08% 9 Free CF to Equity (pre-debt) $2,961 $740 0 Free CF to Equity (actual debt) $3,594 $898 1 Free CF to Equity (target debt ratio) $2,803 $701 2 Cash payout as % of pre-debt FCFE 78.22% 3 Cash payout as % of actual FCFE 64.44% 4 Cash payout as % of target FCFE 82.61% 5 6 ROE 17.69% 7 Return on Stock 9.66% 8 Required Return -3.71% 9 ROE - Required Return 21.40% 0 Return on Stock - Required Return 13.37% 1
Step by Step Solution
There are 3 Steps involved in it
Step: 1

Get Instant Access to Expert-Tailored Solutions
See step-by-step solutions with expert insights and AI powered tools for academic success
Step: 2

Step: 3

Ace Your Homework with AI
Get the answers you need in no time with our AI-driven, step-by-step assistance
Get Started


