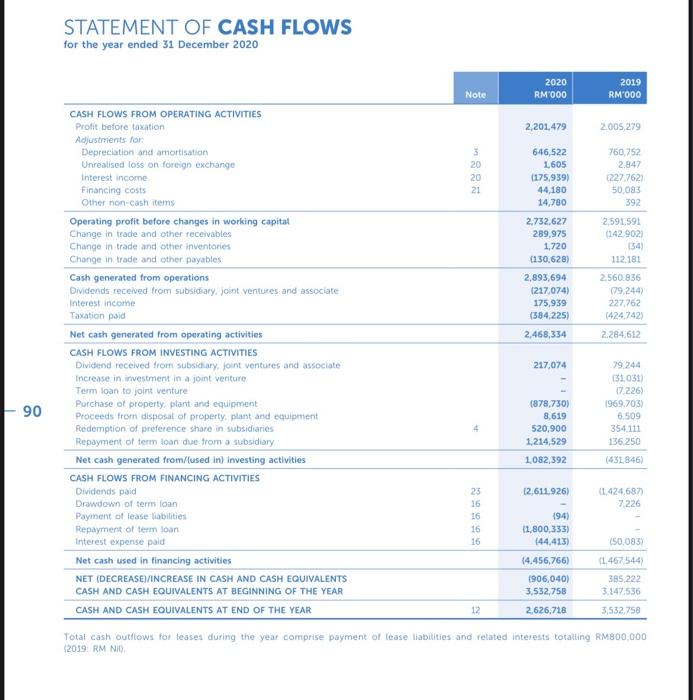
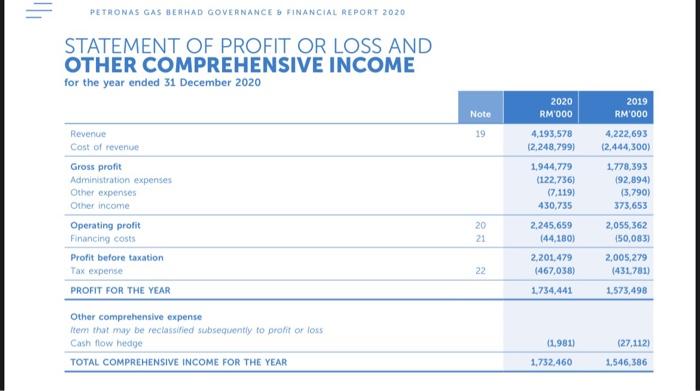
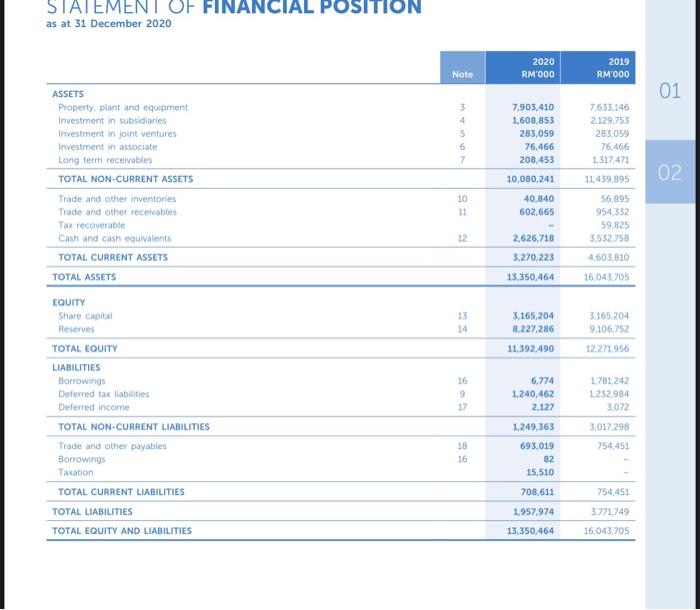
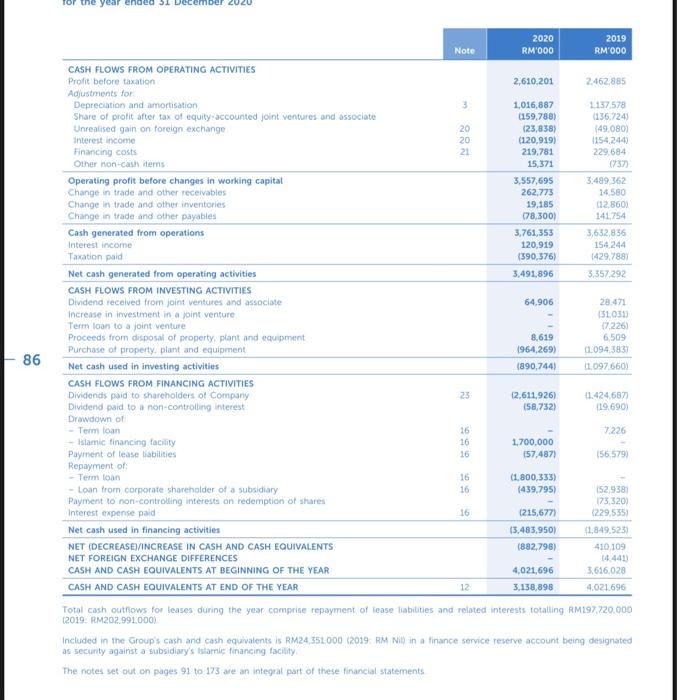
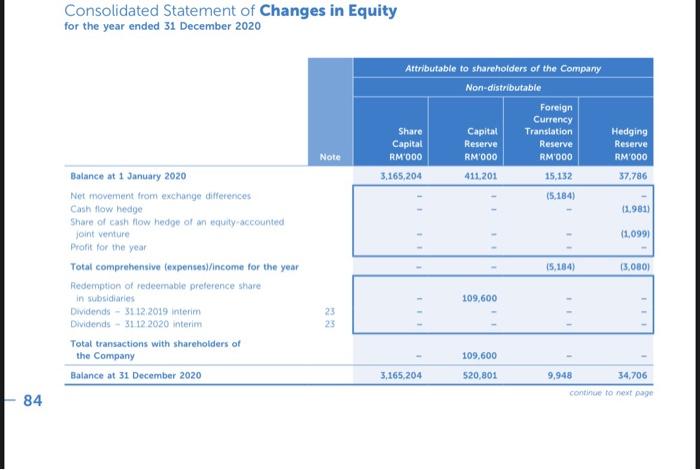
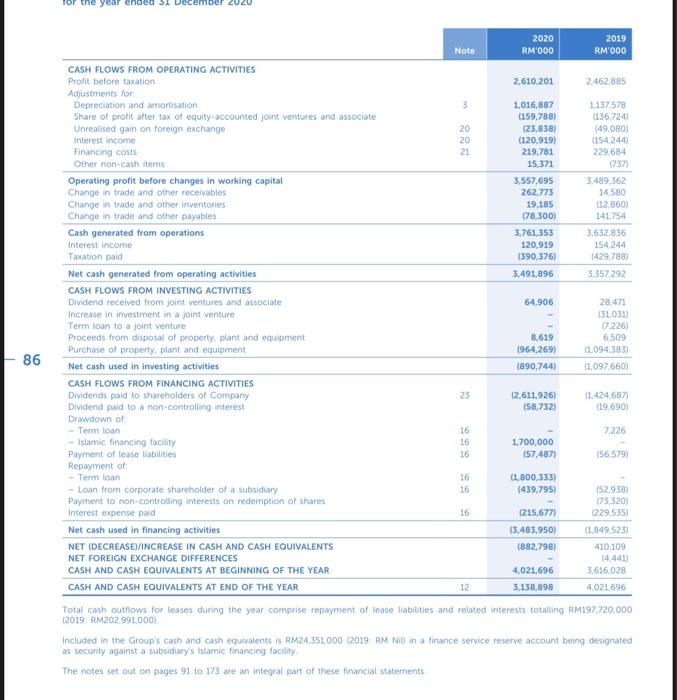
1. Evaluate the cost of capital or WACC for Petronas Gas Berhad for year 2020. To complete financial statements (i.e.
balance sheet, income statement),
2. Evaluate cost of debt / cost of equity / cost of preferred shares of the company based on the annual report of year 2020?
Your analysis can be illustrated
by calculation, theoretical, or both.
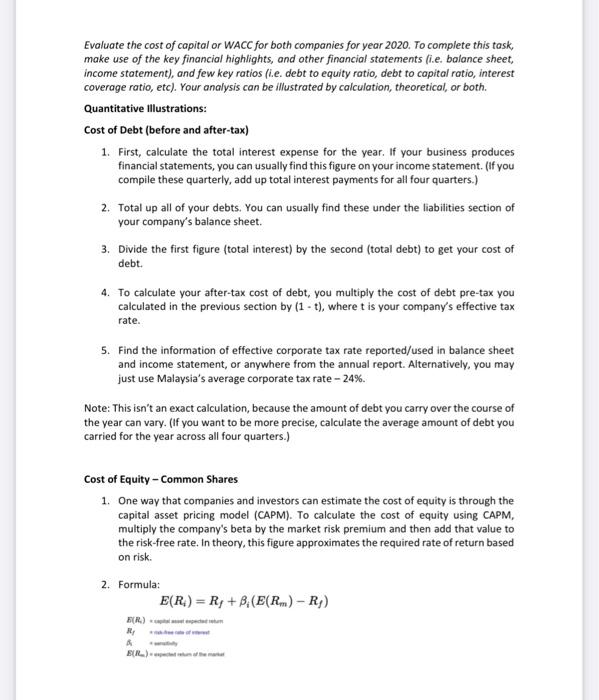
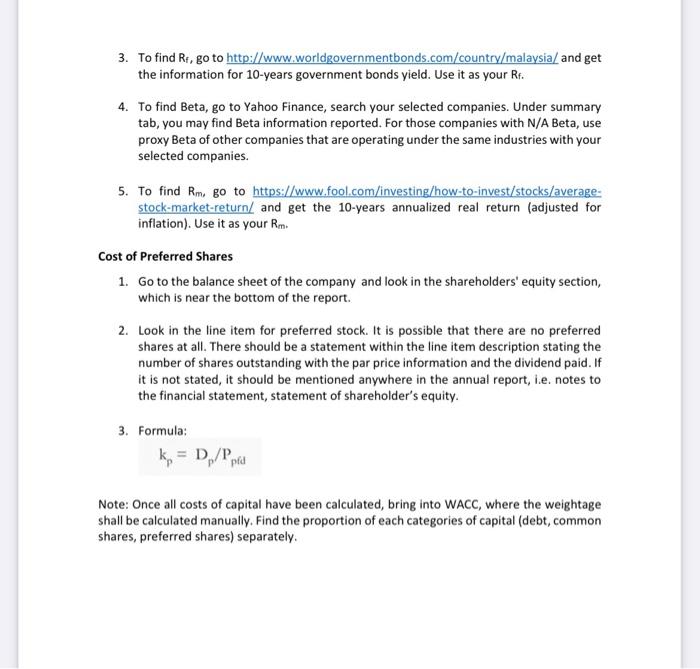
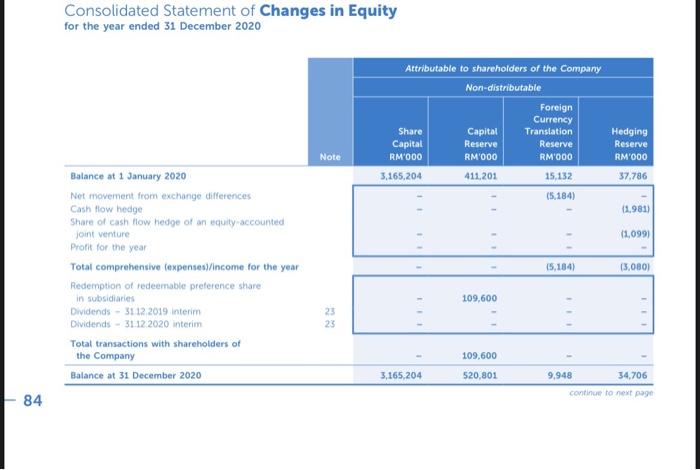
Evaluate the cost of capital or WACC for both companies for year 2020. To complete this task, make use of the key financial highlights, and other financial statements (i.e. balance sheet, income statement), and few key ratios (i.e. debt to equity ratio, debt to capital ratio, interest coverage ratio, etc). Your analysis can be illustrated by calculation, theoretical, or both. Quantitative Illustrations: Cost of Debt (before and after-tax) 1. First, calculate the total interest expense for the year. If your business produces financial statements, you can usually find this figure on your income statement. (If you compile these quarterly, add up total interest payments for all four quarters.) 2. Total up all of your debts. You can usually find these under the liabilities section of your company's balance sheet 3. Divide the first figure (total interest) by the second (total debt) to get your cost of debt. 4. To calculate your after-tax cost of debt, you multiply the cost of debt pre-tax you calculated in the previous section by (1 - t), where t is your company's effective tax rate. 5. Find the information of effective corporate tax rate reported/used in balance sheet and income statement, or anywhere from the annual report. Alternatively, you may just use Malaysia's average corporate tax rate - 24%. Note: This isn't an exact calculation, because the amount of debt you carry over the course of the year can vary. (If you want to be more precise, calculate the average amount of debt you carried for the year across all four quarters.) Cost of Equity - Common Shares 1. One way that companies and investors can estimate the cost of equity is through the capital asset pricing model (CAPM). To calculate the cost of equity using CAPM, multiply the company's beta by the market risk premium and then add that value to the risk-free rate. In theory, this figure approximates the required rate of return based on risk. 2. Formula: E(R) = R+ B. (E(R)-R) FR) Ry A ER) 3. To find Rt, go to http://www.worldgovernmentbonds.com/country/malaysia and get the information for 10-years government bonds yield. Use it as your Rt. 4. To find Beta, go to Yahoo Finance, search your selected companies. Under summary tab, you may find Beta information reported. For those companies with N/A Beta, use proxy Beta of other companies that are operating under the same industries with your selected companies 5. To find Rm. go to https://www.fool.com/investing/how-to-invest/stocks/average- stock-market-return/ and get the 10-years annualized real return (adjusted for inflation). Use it as your Rm. Cost of Preferred Shares 1. Go to the balance sheet of the company and look in the shareholders' equity section, which is near the bottom of the report. 2. Look in the line item for preferred stock. It is possible that there are no preferred shares at all. There should be a statement within the line item description stating the number of shares outstanding with the par price information and the dividend paid. If it is not stated, it should be mentioned anywhere in the annual report, i.e. notes to the financial statement, statement of shareholder's equity. 3. Formula: k = D/Ppru pid Note: Once all costs of capital have been calculated, bring into WACC, where the weightage shall be calculated manually. Find the proportion of each categories of capital (debt, common shares, preferred shares) separately. STATEMENT OF CASH FLOWS for the year ended 31 December 2020 Note 2020 RM000 2019 RM OOO 2,201,479 2005,279 3 20 20 21 760,752 2.847 227.762 50,083 392 646,522 1,605 (175,939) 44,180 14,780 2.732.627 289,975 1,720 1130,6281 2,893,694 (217,074) 175,939 (384,225) 2,468,334 2,591,591 (242.902 154 112181 2.560.836 (79.244) 227,762 (424,742) 2.284612 CASH FLOWS FROM OPERATING ACTIVITIES Profit before taxation Adjustments for Depreciation and amortisation Unrealised loss on foreign exchange Interest income Financing costs Other non-cash items Operating profit before changes in working capital Change in trade and other receivables Change in trade and other inventories Change in trade and other payables Cash generated from operations Dividends received from subsidiary joint ventures and associate Interest income Taxation paid Net cash generated from operating activities CASH FLOWS FROM INVESTING ACTIVITIES Dividend received from subsidiary, joint ventures and associate Increase in investment in a joint venture Term loan to joint venture Purchase of property, plant and equipment Proceeds from disposal of property, plant and equipment Redemption of preference share in subsidiaries Repayment of term loan due from a subsidiary Net cash generated from/tused in investing activities CASH FLOWS FROM FINANCING ACTIVITIES Dividends paid Drawdown of term loan Payment of lease abilities Repayment of term loan Interest expense paid Net cash used in financing activities NET (DECREASE INCREASE IN CASH AND CASH EQUIVALENTS CASH AND CASH EQUIVALENTS AT BEGINNING OF THE YEAR CASH AND CASH EQUIVALENTS AT END OF THE YEAR 217,074 79 244 (31.031 17.226 1969.703) 6509 354.111 136.250 (878,7301 8,619 520,900 1,214,529 1,082,392 90 (431,846) 12.611.926) 11.424687 7.226 23 16 16 16 16 (94) 11,800,333) (44,413) 14.456,766) 1906,040) 3.532,758 2,626,718 150,083) 1.467 544) 385.222 3.147.536 3,532,750 12 Total cash outflows for leases during the year comprise payment of tease liabilities and related interests totalling RM800,000 (2019: RM NID = PETRONAS GAS BERHAD GOVERNANCE FINANCIAL REPORT 2020 STATEMENT OF PROFIT OR LOSS AND OTHER COMPREHENSIVE INCOME for the year ended 31 December 2020 2019 Note 19 2020 RM OOO 4,193,578 12,248,799) 1,944,779 (122,736) (7.119) 430,735 RM'000 4.222.693 (2,444,300) 1.778,393 192,894) (3.790) 373,653 20 21 2,245,659 144,180) Revenue Cost of revenue Gross profit Administration expenses Other expenses Other income Operating profit Financing costs Profit before taxation Tax expense PROFIT FOR THE YEAR Other comprehensive expense Item that may be reclassified subsequently to profit or loss Cash flow hedge TOTAL COMPREHENSIVE INCOME FOR THE YEAR 2,055,362 150,083) 2,005,279 (431781) 1.573,498 2,201,479 (467,038) 1,734,441 22 01.9811 (27.1121 1,546,386 1.732.460 STATEMENT OF FINANCIAL POSITION as at 31 December 2020 2020 RM'000 2019 RM 000 Note 01 3 4 5 6 7 7.903,410 1,608,853 283,059 76,466 208,453 10,080,241 7,633,146 2.129,753 283,059 76.466 1317,471 02 11.439,895 ASSETS Property, plant and equipment Investment in subsidiaries Investment in joint ventures Investment in associate Long term receivables TOTAL NON-CURRENT ASSETS Trade and other inventories Trade and other receivables Tax recoverable Cash and cash equivalents TOTAL CURRENT ASSETS TOTAL ASSETS 10 11 40,840 602,665 56 895 954 352 59,825 3,552,758 12 2,626,718 3,270,223 4,603.810 16.043.705 13.350,464 13 14 3,165,204 8,227,286 11.392.490 3.165.204 9.106.752 12.271.956 16 9 12 6,774 1.240,462 2.127 1.781.242 1,252.984 3,072 EQUITY Share capital Reserves TOTAL EQUITY LIABILITIES Borrowings Deferred tax liabilities Deferred income TOTAL NON-CURRENT LIABILITIES Trade and other payables Borrowings Taxation TOTAL CURRENT LIABILITIES TOTAL LIABILITIES TOTAL EQUITY AND LIABILITIES 1,249,363 3.017.298 754,451 18 16 693,019 82 15,510 708,611 754,451 1.957,974 3.771.749 16,043,705 13,350,464 for the SI De 2020 86 2020 2019 Note RM'000 RM'000 CASH FLOWS FROM OPERATING ACTIVITIES Profit before taxation 2,610,201 2.462,885 Adjustments for Depreciation and amortisation 3 1,016,887 1137578 Share of profit after tax of equity-accounted joint ventures and associate 159,788) (136.724) Unrealised gain on foreign exchange 20 (23,838) (49,080) Interest income 20 120.919) (154244) Financing costs 21 219,781 229,684 Other non-cash items 15,371 (737 Operating profit before changes in working capital 3,557,695 3.489362 Change in trade and other receivables 262.773 16580 Change in trade and other inventories 19.185 112,860) Change in trade and other payables (78,300) 141,754 Cash generated from operations 3.761,353 3,632,836 Interest income 120.919 154244 Taxation paid (390,376) 1429,788 Net cash generated from operating activities 3,491,896 3,357,292 CASH FLOWS FROM INVESTING ACTIVITIES Dividend received from joint ventures and associate 64.906 28.471 Increase in investment in a joint venture 31,031) Term loan to a joint venture (7.226) Proceeds from disposal of property, plant and equipment 8,619 6,509 Purchase of property, plant and equipment 1964,269) 01.094,3831 Net cash used in investing activities (890,744) 11,097 660) CASH FLOWS FROM FINANCING ACTIVITIES Dividends paid to shareholders of Company 23 12,611,926) 11.424.687 Dividend paid to a non-controlling interest 158,732) 119.690) Drawdown of - Term loan 16 7.226 - Islamic financing facility 16 1.700.000 Payment of lease abilities 16 157,487 156.579 Repayment of -Term loan 16 (1.800,333) - Loan from corporate shareholder of a subsidiary 16 (439,795) 152.9381 Payment to non-controlling interests on redemption of shares 173,320 Interest expense paid 16 1215,677) (229,535) Net cash used in financing activities (3.483,950) 11,849,523) NET (DECREASE/INCREASE IN CASH AND CASH EQUIVALENTS (882.798) 410.109 NET FOREIGN EXCHANGE DIFFERENCES 4441 CASH AND CASH EQUIVALENTS AT BEGINNING OF THE YEAR 4,021,696 3.616.028 CASH AND CASH EQUIVALENTS AT END OF THE YEAR 12 3.138,898 4,021 696 Total cash outflows for teases during the year comprise repayment of lease tabilities and related interests totalling RM197.720.000 12019 RM202.991.000). Included in the Group's cash and cash equivalents is RM24,351.000 (2019 RM Nity in a finance service reserve account being designated as security against a subsidiary's Islamic financing facility The notes set out on pages 91 to 173 are an integral part of these financial statements Consolidated Statement of Changes in Equity for the year ended 31 December 2020 Attributable to shareholders of the Company Non-distributable Foreign Currency Share Capital Translation Capital Reserve Reserve RM000 RM000 RM'000 3,165,204 411,201 (5,184) Note Hedging Reserve RM'000 37.786 15.132 1981) (1,099) 15.184) 15.0801 Balance at 1 January 2020 Not movement from exchange differences Cash flow hedge Share of cash flow hedge of an equity accounted joint venture Profit for the year Total comprehensive expenses/income for the year Redemption of redeemable preference share in subsidiaries Dividends - 31.12.2019 interim Dividends - 31.12.2020 interim Total transactions with shareholders of the Company Balance at 31 December 2020 109,600 23 23 109,600 3,165,204 520,801 9,948 34,706 continue to next page 84 for the ended SI Dec 2020 86 2020 2019 Note RM'000 RM OOO CASH FLOWS FROM OPERATING ACTIVITIES Profit before taxation 2,610,201 2.462,885 Adjustments for Depreciation and amortisation 3 1,016,887 1.137578 Share of profit after tax of equity-accounted joint ventures and associate (159.788) (136.724) Unrealised gain on foreign exchange 20 (23.838) 149.00) Interest income 20 120.919) 1154, 244) Financing costs 21 219,781 229.684 Other non-cash items 15,371 (737 Operating profit before changes in working capital 3,557,695 3.489 362 Change in trade and other receivables 262.773 14.580 Change in trade and other inventories 19.185 (12.860) Change in trade and other payables (78,300) 141754 Cash generated from operations 3,761,353 3,632,836 Interest income 120.919 154,244 Taxation pold (390,376) 1429,7880 Net cash generated from operating activities 3,491,896 3,357,292 CASH FLOWS FROM INVESTING ACTIVITIES Dividend received from joint ventures and associate 64.906 28.471 Increase in investment in a joint venture 131,031) Term loan to a joint venture (7,226) Proceeds from disposal of property, plant and equipment 8,619 6,509 Purchase of property, plant and equipment 1964,269) 010943833 Net cash used in investing activities (890,744) 1,097 660) CASH FLOWS FROM FINANCING ACTIVITIES Dividends paid to shareholders of Company 23 12,611.926) 1.424,687 Dividend paid to a non-controlling interest 158,732) 119.690) Drawdown of - Term loan 16 7.226 - Islamic financing facility 16 1.700.000 Payment of lease abilities 16 157.4871 156.579) Repayment of -Term loan 16 (1.800,333) - Loan from corporate shareholder of a subsidiary 16 (439,795) 152.9381 Payment to non-controlling interests on redemption of shares 173,320) Interest expense paid 16 (215,677) 229,535) Net cash used in financing activities 13,483,950) 11,849,523) NET (DECREASE/INCREASE IN CASH AND CASH EQUIVALENTS (882.798) 410,109 NET FOREIGN EXCHANGE DIFFERENCES 14.441 CASH AND CASH EQUIVALENTS AT BEGINNING OF THE YEAR 4,021,696 3,616,028 CASH AND CASH EQUIVALENTS AT END OF THE YEAR 12 3.138,898 4,021696 Total cash outflows for teases during the year comprise repayment of tease liabilities and related interests totalling RM197.720.000 12019: RM202.991.000). Included in the Group's cash and cash equivalents is RM24.351.000 (2019 RM Nit) in a finance service reserve account being designated as secunty against a subsidiary's Islamic financing facility The notes set out on pages 91 to 173 are an integral part of these financial statements Consolidated Statement of Changes in Equity for the year ended 31 December 2020 Attributable to shareholders of the Company Non-distributable Foreign Currency Share Capital Translation Capital Reserve Reserve RM'000 RM'000 RM'000 3,165,204 411,201 15,132 (5,184) Note Hedging Reserve RM'000 37.786 1981) (1,099) 15.184) 13,0801 Balance at 1 January 2020 Not movement from exchange differences Cash flow hedge Share of cash flow hedge of an equity accounted joint venture Profit for the year Total comprehensive expenses/income for the year Redemption of redeemable preference share in subsidiaries Dividends - 31.12.2019 interim Dividends - 31.12.2020 interim Total transactions with shareholders of the Company Balance at 31 December 2020 109,600 23 23 109,600 3,165,204 520,801 9,948 34,706 continue to next page 84 Evaluate the cost of capital or WACC for both companies for year 2020. To complete this task, make use of the key financial highlights, and other financial statements (i.e. balance sheet, income statement), and few key ratios (i.e. debt to equity ratio, debt to capital ratio, interest coverage ratio, etc). Your analysis can be illustrated by calculation, theoretical, or both. Quantitative Illustrations: Cost of Debt (before and after-tax) 1. First, calculate the total interest expense for the year. If your business produces financial statements, you can usually find this figure on your income statement. (If you compile these quarterly, add up total interest payments for all four quarters.) 2. Total up all of your debts. You can usually find these under the liabilities section of your company's balance sheet 3. Divide the first figure (total interest) by the second (total debt) to get your cost of debt. 4. To calculate your after-tax cost of debt, you multiply the cost of debt pre-tax you calculated in the previous section by (1 - t), where t is your company's effective tax rate. 5. Find the information of effective corporate tax rate reported/used in balance sheet and income statement, or anywhere from the annual report. Alternatively, you may just use Malaysia's average corporate tax rate - 24%. Note: This isn't an exact calculation, because the amount of debt you carry over the course of the year can vary. (If you want to be more precise, calculate the average amount of debt you carried for the year across all four quarters.) Cost of Equity - Common Shares 1. One way that companies and investors can estimate the cost of equity is through the capital asset pricing model (CAPM). To calculate the cost of equity using CAPM, multiply the company's beta by the market risk premium and then add that value to the risk-free rate. In theory, this figure approximates the required rate of return based on risk. 2. Formula: E(R) = R+ B. (E(R)-R) FR) Ry A ER) 3. To find Rt, go to http://www.worldgovernmentbonds.com/country/malaysia and get the information for 10-years government bonds yield. Use it as your Rt. 4. To find Beta, go to Yahoo Finance, search your selected companies. Under summary tab, you may find Beta information reported. For those companies with N/A Beta, use proxy Beta of other companies that are operating under the same industries with your selected companies 5. To find Rm. go to https://www.fool.com/investing/how-to-invest/stocks/average- stock-market-return/ and get the 10-years annualized real return (adjusted for inflation). Use it as your Rm. Cost of Preferred Shares 1. Go to the balance sheet of the company and look in the shareholders' equity section, which is near the bottom of the report. 2. Look in the line item for preferred stock. It is possible that there are no preferred shares at all. There should be a statement within the line item description stating the number of shares outstanding with the par price information and the dividend paid. If it is not stated, it should be mentioned anywhere in the annual report, i.e. notes to the financial statement, statement of shareholder's equity. 3. Formula: k = D/Ppru pid Note: Once all costs of capital have been calculated, bring into WACC, where the weightage shall be calculated manually. Find the proportion of each categories of capital (debt, common shares, preferred shares) separately. STATEMENT OF CASH FLOWS for the year ended 31 December 2020 Note 2020 RM000 2019 RM OOO 2,201,479 2005,279 3 20 20 21 760,752 2.847 227.762 50,083 392 646,522 1,605 (175,939) 44,180 14,780 2.732.627 289,975 1,720 1130,6281 2,893,694 (217,074) 175,939 (384,225) 2,468,334 2,591,591 (242.902 154 112181 2.560.836 (79.244) 227,762 (424,742) 2.284612 CASH FLOWS FROM OPERATING ACTIVITIES Profit before taxation Adjustments for Depreciation and amortisation Unrealised loss on foreign exchange Interest income Financing costs Other non-cash items Operating profit before changes in working capital Change in trade and other receivables Change in trade and other inventories Change in trade and other payables Cash generated from operations Dividends received from subsidiary joint ventures and associate Interest income Taxation paid Net cash generated from operating activities CASH FLOWS FROM INVESTING ACTIVITIES Dividend received from subsidiary, joint ventures and associate Increase in investment in a joint venture Term loan to joint venture Purchase of property, plant and equipment Proceeds from disposal of property, plant and equipment Redemption of preference share in subsidiaries Repayment of term loan due from a subsidiary Net cash generated from/tused in investing activities CASH FLOWS FROM FINANCING ACTIVITIES Dividends paid Drawdown of term loan Payment of lease abilities Repayment of term loan Interest expense paid Net cash used in financing activities NET (DECREASE INCREASE IN CASH AND CASH EQUIVALENTS CASH AND CASH EQUIVALENTS AT BEGINNING OF THE YEAR CASH AND CASH EQUIVALENTS AT END OF THE YEAR 217,074 79 244 (31.031 17.226 1969.703) 6509 354.111 136.250 (878,7301 8,619 520,900 1,214,529 1,082,392 90 (431,846) 12.611.926) 11.424687 7.226 23 16 16 16 16 (94) 11,800,333) (44,413) 14.456,766) 1906,040) 3.532,758 2,626,718 150,083) 1.467 544) 385.222 3.147.536 3,532,750 12 Total cash outflows for leases during the year comprise payment of tease liabilities and related interests totalling RM800,000 (2019: RM NID = PETRONAS GAS BERHAD GOVERNANCE FINANCIAL REPORT 2020 STATEMENT OF PROFIT OR LOSS AND OTHER COMPREHENSIVE INCOME for the year ended 31 December 2020 2019 Note 19 2020 RM OOO 4,193,578 12,248,799) 1,944,779 (122,736) (7.119) 430,735 RM'000 4.222.693 (2,444,300) 1.778,393 192,894) (3.790) 373,653 20 21 2,245,659 144,180) Revenue Cost of revenue Gross profit Administration expenses Other expenses Other income Operating profit Financing costs Profit before taxation Tax expense PROFIT FOR THE YEAR Other comprehensive expense Item that may be reclassified subsequently to profit or loss Cash flow hedge TOTAL COMPREHENSIVE INCOME FOR THE YEAR 2,055,362 150,083) 2,005,279 (431781) 1.573,498 2,201,479 (467,038) 1,734,441 22 01.9811 (27.1121 1,546,386 1.732.460 STATEMENT OF FINANCIAL POSITION as at 31 December 2020 2020 RM'000 2019 RM 000 Note 01 3 4 5 6 7 7.903,410 1,608,853 283,059 76,466 208,453 10,080,241 7,633,146 2.129,753 283,059 76.466 1317,471 02 11.439,895 ASSETS Property, plant and equipment Investment in subsidiaries Investment in joint ventures Investment in associate Long term receivables TOTAL NON-CURRENT ASSETS Trade and other inventories Trade and other receivables Tax recoverable Cash and cash equivalents TOTAL CURRENT ASSETS TOTAL ASSETS 10 11 40,840 602,665 56 895 954 352 59,825 3,552,758 12 2,626,718 3,270,223 4,603.810 16.043.705 13.350,464 13 14 3,165,204 8,227,286 11.392.490 3.165.204 9.106.752 12.271.956 16 9 12 6,774 1.240,462 2.127 1.781.242 1,252.984 3,072 EQUITY Share capital Reserves TOTAL EQUITY LIABILITIES Borrowings Deferred tax liabilities Deferred income TOTAL NON-CURRENT LIABILITIES Trade and other payables Borrowings Taxation TOTAL CURRENT LIABILITIES TOTAL LIABILITIES TOTAL EQUITY AND LIABILITIES 1,249,363 3.017.298 754,451 18 16 693,019 82 15,510 708,611 754,451 1.957,974 3.771.749 16,043,705 13,350,464 for the SI De 2020 86 2020 2019 Note RM'000 RM'000 CASH FLOWS FROM OPERATING ACTIVITIES Profit before taxation 2,610,201 2.462,885 Adjustments for Depreciation and amortisation 3 1,016,887 1137578 Share of profit after tax of equity-accounted joint ventures and associate 159,788) (136.724) Unrealised gain on foreign exchange 20 (23,838) (49,080) Interest income 20 120.919) (154244) Financing costs 21 219,781 229,684 Other non-cash items 15,371 (737 Operating profit before changes in working capital 3,557,695 3.489362 Change in trade and other receivables 262.773 16580 Change in trade and other inventories 19.185 112,860) Change in trade and other payables (78,300) 141,754 Cash generated from operations 3.761,353 3,632,836 Interest income 120.919 154244 Taxation paid (390,376) 1429,788 Net cash generated from operating activities 3,491,896 3,357,292 CASH FLOWS FROM INVESTING ACTIVITIES Dividend received from joint ventures and associate 64.906 28.471 Increase in investment in a joint venture 31,031) Term loan to a joint venture (7.226) Proceeds from disposal of property, plant and equipment 8,619 6,509 Purchase of property, plant and equipment 1964,269) 01.094,3831 Net cash used in investing activities (890,744) 11,097 660) CASH FLOWS FROM FINANCING ACTIVITIES Dividends paid to shareholders of Company 23 12,611,926) 11.424.687 Dividend paid to a non-controlling interest 158,732) 119.690) Drawdown of - Term loan 16 7.226 - Islamic financing facility 16 1.700.000 Payment of lease abilities 16 157,487 156.579 Repayment of -Term loan 16 (1.800,333) - Loan from corporate shareholder of a subsidiary 16 (439,795) 152.9381 Payment to non-controlling interests on redemption of shares 173,320 Interest expense paid 16 1215,677) (229,535) Net cash used in financing activities (3.483,950) 11,849,523) NET (DECREASE/INCREASE IN CASH AND CASH EQUIVALENTS (882.798) 410.109 NET FOREIGN EXCHANGE DIFFERENCES 4441 CASH AND CASH EQUIVALENTS AT BEGINNING OF THE YEAR 4,021,696 3.616.028 CASH AND CASH EQUIVALENTS AT END OF THE YEAR 12 3.138,898 4,021 696 Total cash outflows for teases during the year comprise repayment of lease tabilities and related interests totalling RM197.720.000 12019 RM202.991.000). Included in the Group's cash and cash equivalents is RM24,351.000 (2019 RM Nity in a finance service reserve account being designated as security against a subsidiary's Islamic financing facility The notes set out on pages 91 to 173 are an integral part of these financial statements Consolidated Statement of Changes in Equity for the year ended 31 December 2020 Attributable to shareholders of the Company Non-distributable Foreign Currency Share Capital Translation Capital Reserve Reserve RM000 RM000 RM'000 3,165,204 411,201 (5,184) Note Hedging Reserve RM'000 37.786 15.132 1981) (1,099) 15.184) 15.0801 Balance at 1 January 2020 Not movement from exchange differences Cash flow hedge Share of cash flow hedge of an equity accounted joint venture Profit for the year Total comprehensive expenses/income for the year Redemption of redeemable preference share in subsidiaries Dividends - 31.12.2019 interim Dividends - 31.12.2020 interim Total transactions with shareholders of the Company Balance at 31 December 2020 109,600 23 23 109,600 3,165,204 520,801 9,948 34,706 continue to next page 84 for the ended SI Dec 2020 86 2020 2019 Note RM'000 RM OOO CASH FLOWS FROM OPERATING ACTIVITIES Profit before taxation 2,610,201 2.462,885 Adjustments for Depreciation and amortisation 3 1,016,887 1.137578 Share of profit after tax of equity-accounted joint ventures and associate (159.788) (136.724) Unrealised gain on foreign exchange 20 (23.838) 149.00) Interest income 20 120.919) 1154, 244) Financing costs 21 219,781 229.684 Other non-cash items 15,371 (737 Operating profit before changes in working capital 3,557,695 3.489 362 Change in trade and other receivables 262.773 14.580 Change in trade and other inventories 19.185 (12.860) Change in trade and other payables (78,300) 141754 Cash generated from operations 3,761,353 3,632,836 Interest income 120.919 154,244 Taxation pold (390,376) 1429,7880 Net cash generated from operating activities 3,491,896 3,357,292 CASH FLOWS FROM INVESTING ACTIVITIES Dividend received from joint ventures and associate 64.906 28.471 Increase in investment in a joint venture 131,031) Term loan to a joint venture (7,226) Proceeds from disposal of property, plant and equipment 8,619 6,509 Purchase of property, plant and equipment 1964,269) 010943833 Net cash used in investing activities (890,744) 1,097 660) CASH FLOWS FROM FINANCING ACTIVITIES Dividends paid to shareholders of Company 23 12,611.926) 1.424,687 Dividend paid to a non-controlling interest 158,732) 119.690) Drawdown of - Term loan 16 7.226 - Islamic financing facility 16 1.700.000 Payment of lease abilities 16 157.4871 156.579) Repayment of -Term loan 16 (1.800,333) - Loan from corporate shareholder of a subsidiary 16 (439,795) 152.9381 Payment to non-controlling interests on redemption of shares 173,320) Interest expense paid 16 (215,677) 229,535) Net cash used in financing activities 13,483,950) 11,849,523) NET (DECREASE/INCREASE IN CASH AND CASH EQUIVALENTS (882.798) 410,109 NET FOREIGN EXCHANGE DIFFERENCES 14.441 CASH AND CASH EQUIVALENTS AT BEGINNING OF THE YEAR 4,021,696 3,616,028 CASH AND CASH EQUIVALENTS AT END OF THE YEAR 12 3.138,898 4,021696 Total cash outflows for teases during the year comprise repayment of tease liabilities and related interests totalling RM197.720.000 12019: RM202.991.000). Included in the Group's cash and cash equivalents is RM24.351.000 (2019 RM Nit) in a finance service reserve account being designated as secunty against a subsidiary's Islamic financing facility The notes set out on pages 91 to 173 are an integral part of these financial statements Consolidated Statement of Changes in Equity for the year ended 31 December 2020 Attributable to shareholders of the Company Non-distributable Foreign Currency Share Capital Translation Capital Reserve Reserve RM'000 RM'000 RM'000 3,165,204 411,201 15,132 (5,184) Note Hedging Reserve RM'000 37.786 1981) (1,099) 15.184) 13,0801 Balance at 1 January 2020 Not movement from exchange differences Cash flow hedge Share of cash flow hedge of an equity accounted joint venture Profit for the year Total comprehensive expenses/income for the year Redemption of redeemable preference share in subsidiaries Dividends - 31.12.2019 interim Dividends - 31.12.2020 interim Total transactions with shareholders of the Company Balance at 31 December 2020 109,600 23 23 109,600 3,165,204 520,801 9,948 34,706 continue to next page 84
