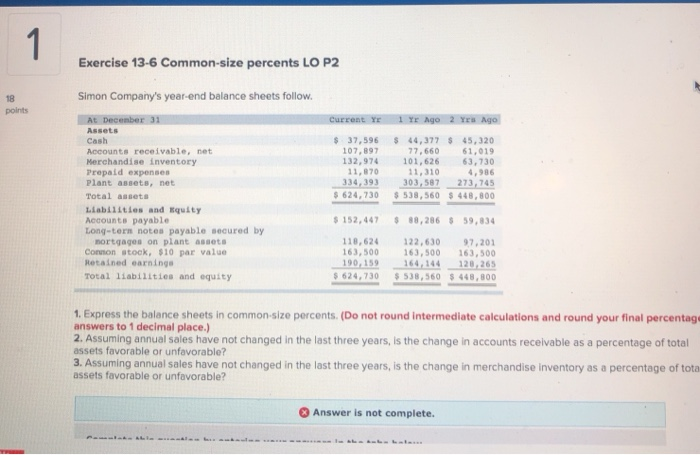
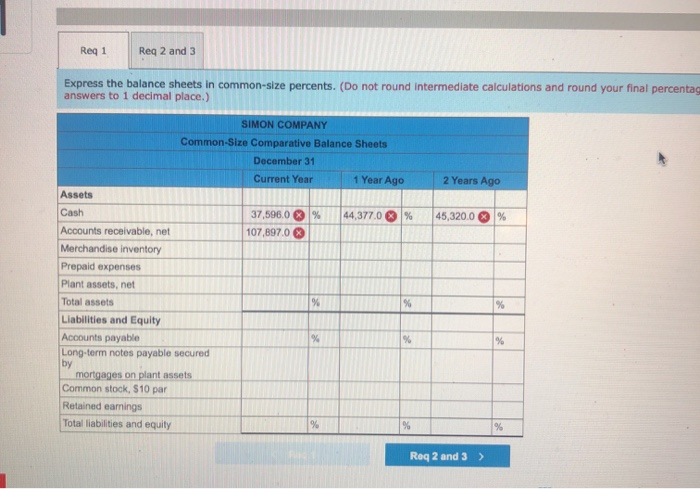
1 Exercise 13-6 Common-size percents LO P2 18 points Current YE 1 Yr Ago 2 Yes Ago Simon Company's year-end balance sheets follow. At December 31 Assets Cash Accounts receivable, net Merchandise inventory Prepaid expenses Plant assets, net Total assets Liabilities and Equity Accounts payable Long-tern notes payable secured by mortgages on plant assets Connon stock, $10 par value Retained earnings Total liabilities and equity $ 37,596 107,897 132,974 11,870 334,393 $ 624,730 $ 44,377 $ 45,320 77.660 61,019 101,626 63,730 11,310 4,986 303,587 273, 745 $ 538,560 5448,800 $ 152,447 $ 88,286 359,834 118,624 163,500 190.159 $ 624,730 122,630 97,201 163,500 163,500 164,144 120.265 $ 538,560 5448,800 1. Express the balance sheets in common size percents. (Do not round intermediate calculations and round your final percentage answers to 1 decimal place.) 2. Assuming annual sales have not changed in the last three years, is the change in accounts receivable as a percentage of total assets favorable or unfavorable? 3. Assuming annual sales have not changed in the last three years, is the change in merchandise inventory as a percentage of tota assets favorable or unfavorable? Answer is not complete. Reg 1 Reg 2 and 3 Express the balance sheets in common-size percents. (Do not round Intermediate calculations and round your final percentag answers to 1 decimal place.) 2 Years Ago 45,320.0 SIMON COMPANY Common-Size Comparative Balance Sheets December 31 Current Year 1 Year Ago Assets Cash 37,596.0 % 44,377.0 % Accounts receivable, net 107,897.0 Merchandise inventory Prepaid expenses Plant assets, net Total assets % % Liabilities and Equity Accounts payable % % Long-term notes payable secured by mortgages on plant assets Common stock, $10 par Retained earnings Total liabilities and equity % % % % Req 2 and 3 >