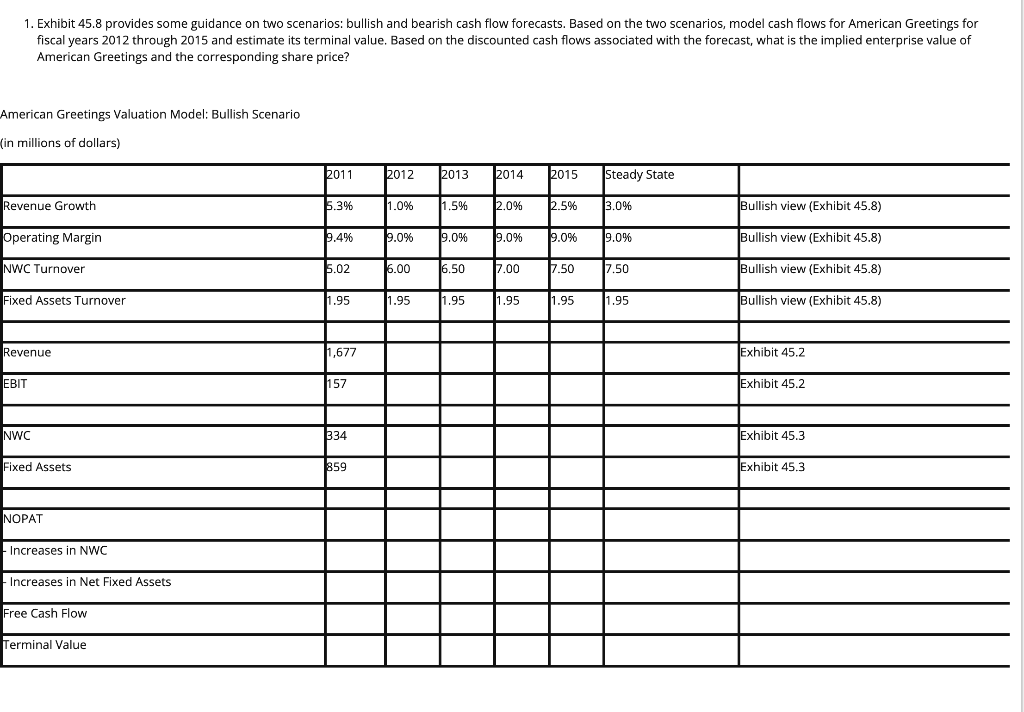
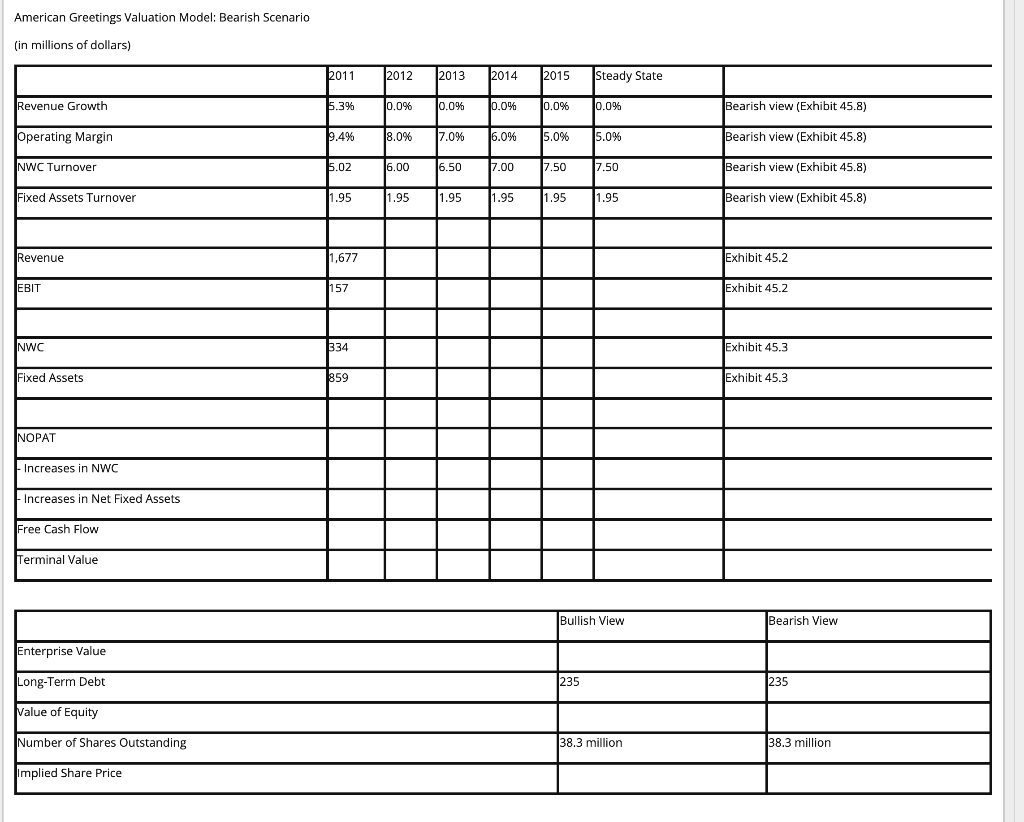
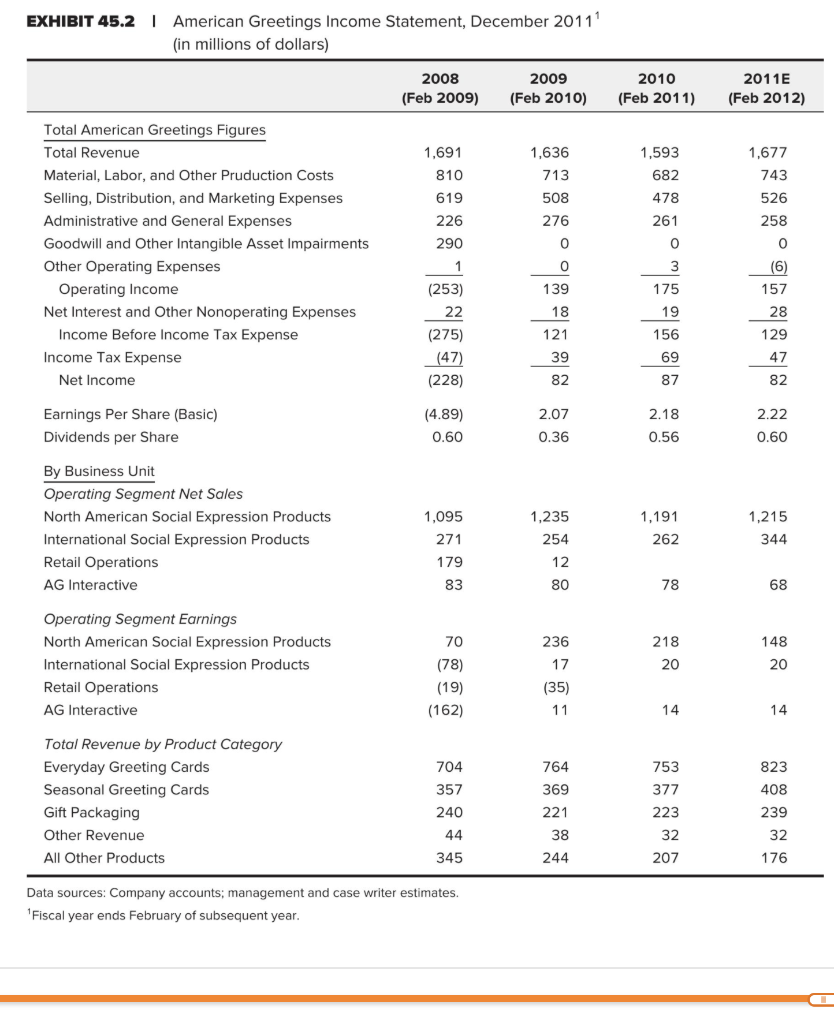
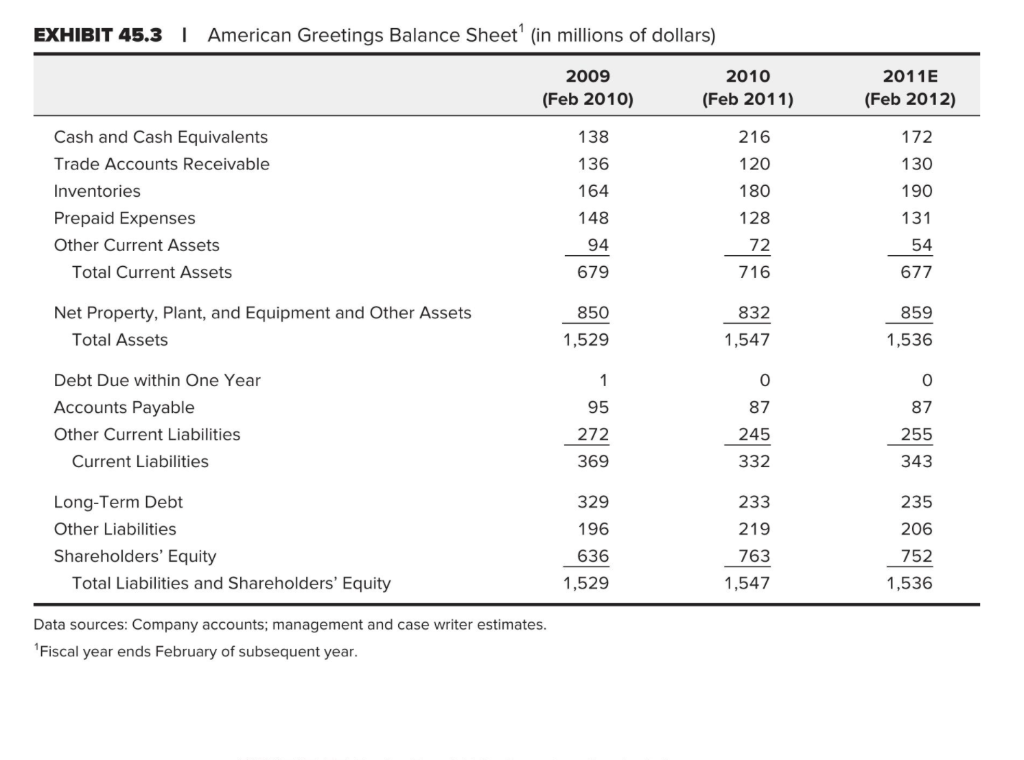
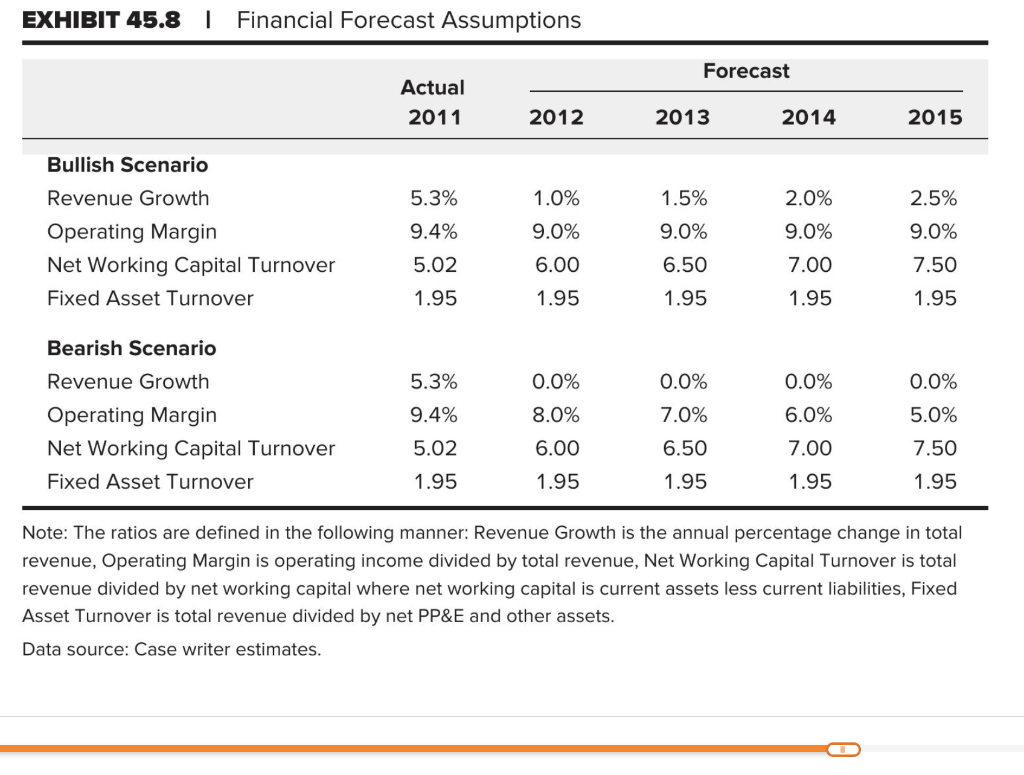
1. Exhibit 45.8 provides some guidance on two scenarios: bullish and bearish cash flow forecasts. Based on the two scenarios, model cash flows for American Greetings for fiscal years 2012 through 2015 and estimate its terminal value. Based on the discounted cash flows associated with the forecast, what is the implied enterprise value of American Greetings and the corresponding share price? American Greetings Valuation Model: Bullish Scenario (in millions of dollars) ) 2011 2012 2013 2014 12015 Steady State Revenue Growth 6.3% 1.0% 1.5% 2.0% 2.5% 3.0% Bullish view (Exhibit 45.8) Operating Margin 9.4% 9.0% 9.0% 19.0% 9.0% 9.0% Bullish view (Exhibit 45.8) NWC Turnover 6.02 6.00 6.50 7.00 7.50 7.50 Bullish view (Exhibit 45.8) Fixed Assets Turnover 1.95 1.95 1.95 1.95 1.95 11.95 Bullish view (Exhibit 45.8) Revenue 1,677 Exhibit 45.2 EBIT 157 Exhibit 45.2 NWC 334 Exhibit 45.3 Fixed Assets 859 JExhibit 45.3 NOPAT - Increases in NWC - Increases in Net Fixed Assets Free Cash Flow Terminal Value American Greetings Valuation Model: Bearish Scenario (in millions of dollars) *011 2012 2013 2014 2015 Steady State Revenue Growth $5.3% 0.0% 0.0% 0.0% 0.0% % 10.0% Bearish view (Exhibit 45.8) Operating Margin 1.4% 18.0% 7.0% 16.0% 5.0% 15.0% Bearish view (Exhibit 45.8) INWC Turnover 5.02 16.00 6.50 7.00 7.50 7.50 Bearish view (Exhibit 45.8) Fixed Assets Turnover 1.95 1.95 1.95 1.95 1.95 1.95 Bearish view (Exhibit 45.8) Revenue 1,677 Exhibit 45.2 EBIT 157 Exhibit 45.2 INWC 334 Exhibit 45.3 Fixed Assets 859 Exhibit 45.3 INOPAT Increases in NWC Increases in Net Fixed Assets Free Cash Flow Terminal Value Bullish View Bearish View Enterprise Value Long-Term Debt 235 235 Value of Equity Number of Shares Outstanding 38.3 million 38.3 million Implied Share Price EXHIBIT 45.2 | American Greetings Income Statement, December 2011 (in millions of dollars) 2008 (Feb 2009) 2009 (Feb 2010) 2010 (Feb 2011) 2011E (Feb 2012) 1,593 682 1,677 743 1,636 713 508 276 478 261 526 258 0 0 0 Total American Greetings Figures Total Revenue Material, Labor, and Other Pruduction Costs Selling, Distribution, and Marketing Expenses Administrative and General Expenses Goodwill and Other Intangible Asset Impairments Other Operating Expenses Operating Income Net Interest and Other Nonoperating Expenses Income Before Income Tax Expense Income Tax Expense Net Income 1,691 810 619 226 290 1 (253) 22 (275) (47) (228) 0 139 18 121 3 175 19 156 (6) 157 28 129 39 69 47 82 87 82 2.18 Earnings Per Share (Basic) Dividends per Share (4.89) 0.60 2.07 0.36 2.22 0.60 0.56 By Business Unit Operating Segment Net Sales North American Social Expression Products International Social Expression Products Retail Operations AG Interactive 1,095 271 179 1,235 254 1,191 262 1,215 344 12 83 80 78 68 236 218 148 Operating Segment Earnings North American Social Expression Products International Social Expression Products Retail Operations AG Interactive 20 20 70 (78) (19) (162) 17 (35) 11 14 14 Total Revenue by Product Category Everyday Greeting Cards Seasonal Greeting Cards Gift Packaging Other Revenue All Other Products 704 357 240 823 408 764 369 221 38 244 753 377 223 32 207 239 44 32 176 345 Data sources: Company accounts; management and case writer estimates. Fiscal year ends February of subsequent year. EXHIBIT 45.3 | American Greetings Balance Sheet' (in millions of dollars) 2009 (Feb 2010) 2010 (Feb 2011) 2011E (Feb 2012) 138 216 136 120 180 Cash and Cash Equivalents Trade Accounts Receivable Inventories Prepaid Expenses Other Current Assets Total Current Assets 172 130 190 131 164 148 128 54 94 679 72 716 677 859 Net Property, plant, and Equipment and Other Assets Total Assets 850 1,529 832 1,547 1,536 0 0 87 87 Debt Due within One Year Accounts Payable Other Current Liabilities Current Liabilities 1 95 272 369 245 255 343 332 233 235 219 Long-Term Debt Other Liabilities Shareholders' Equity Total Liabilities and Shareholders' Equity 329 196 636 1,529 763 1,547 206 752 1,536 Data sources: Company accounts; management and case writer estimates. "Fiscal year ends February of subsequent year. EXHIBIT 45.8 Financial Forecast Assumptions Forecast Actual 2011 2012 2013 2014 2015 Bullish Scenario 5.3% 1.0% 2.0% 2.5% 9.4% Revenue Growth Operating Margin Net Working Capital Turnover Fixed Asset Turnover 1.5% 9.0% 6.50 1.95 9.0% 6.00 1.95 9.0% 7.00 9.0% 7.50 5.02 1.95 1.95 1.95 5.3% 0.0% 0.0% 0.0% Bearish Scenario Revenue Growth Operating Margin Net Working Capital Turnover Fixed Asset Turnover 9.4% 8.0% 5.02 1.95 0.0% 5.0% 7.50 1.95 7.0% 6.50 1.95 6.00 1.95 6.0% 7.00 1.95 Note: The ratios are defined in the following manner: Revenue Growth is the annual percentage change in total revenue, Operating Margin is operating income divided by total revenue, Net Working Capital Turnover is total revenue divided by net working capital where net working capital is current assets less current liabilities, Fixed Asset Turnover is total revenue divided by net PP&E and other assets. Data source: Case writer estimates. 1. Exhibit 45.8 provides some guidance on two scenarios: bullish and bearish cash flow forecasts. Based on the two scenarios, model cash flows for American Greetings for fiscal years 2012 through 2015 and estimate its terminal value. Based on the discounted cash flows associated with the forecast, what is the implied enterprise value of American Greetings and the corresponding share price? American Greetings Valuation Model: Bullish Scenario (in millions of dollars) ) 2011 2012 2013 2014 12015 Steady State Revenue Growth 6.3% 1.0% 1.5% 2.0% 2.5% 3.0% Bullish view (Exhibit 45.8) Operating Margin 9.4% 9.0% 9.0% 19.0% 9.0% 9.0% Bullish view (Exhibit 45.8) NWC Turnover 6.02 6.00 6.50 7.00 7.50 7.50 Bullish view (Exhibit 45.8) Fixed Assets Turnover 1.95 1.95 1.95 1.95 1.95 11.95 Bullish view (Exhibit 45.8) Revenue 1,677 Exhibit 45.2 EBIT 157 Exhibit 45.2 NWC 334 Exhibit 45.3 Fixed Assets 859 JExhibit 45.3 NOPAT - Increases in NWC - Increases in Net Fixed Assets Free Cash Flow Terminal Value American Greetings Valuation Model: Bearish Scenario (in millions of dollars) *011 2012 2013 2014 2015 Steady State Revenue Growth $5.3% 0.0% 0.0% 0.0% 0.0% % 10.0% Bearish view (Exhibit 45.8) Operating Margin 1.4% 18.0% 7.0% 16.0% 5.0% 15.0% Bearish view (Exhibit 45.8) INWC Turnover 5.02 16.00 6.50 7.00 7.50 7.50 Bearish view (Exhibit 45.8) Fixed Assets Turnover 1.95 1.95 1.95 1.95 1.95 1.95 Bearish view (Exhibit 45.8) Revenue 1,677 Exhibit 45.2 EBIT 157 Exhibit 45.2 INWC 334 Exhibit 45.3 Fixed Assets 859 Exhibit 45.3 INOPAT Increases in NWC Increases in Net Fixed Assets Free Cash Flow Terminal Value Bullish View Bearish View Enterprise Value Long-Term Debt 235 235 Value of Equity Number of Shares Outstanding 38.3 million 38.3 million Implied Share Price EXHIBIT 45.2 | American Greetings Income Statement, December 2011 (in millions of dollars) 2008 (Feb 2009) 2009 (Feb 2010) 2010 (Feb 2011) 2011E (Feb 2012) 1,593 682 1,677 743 1,636 713 508 276 478 261 526 258 0 0 0 Total American Greetings Figures Total Revenue Material, Labor, and Other Pruduction Costs Selling, Distribution, and Marketing Expenses Administrative and General Expenses Goodwill and Other Intangible Asset Impairments Other Operating Expenses Operating Income Net Interest and Other Nonoperating Expenses Income Before Income Tax Expense Income Tax Expense Net Income 1,691 810 619 226 290 1 (253) 22 (275) (47) (228) 0 139 18 121 3 175 19 156 (6) 157 28 129 39 69 47 82 87 82 2.18 Earnings Per Share (Basic) Dividends per Share (4.89) 0.60 2.07 0.36 2.22 0.60 0.56 By Business Unit Operating Segment Net Sales North American Social Expression Products International Social Expression Products Retail Operations AG Interactive 1,095 271 179 1,235 254 1,191 262 1,215 344 12 83 80 78 68 236 218 148 Operating Segment Earnings North American Social Expression Products International Social Expression Products Retail Operations AG Interactive 20 20 70 (78) (19) (162) 17 (35) 11 14 14 Total Revenue by Product Category Everyday Greeting Cards Seasonal Greeting Cards Gift Packaging Other Revenue All Other Products 704 357 240 823 408 764 369 221 38 244 753 377 223 32 207 239 44 32 176 345 Data sources: Company accounts; management and case writer estimates. Fiscal year ends February of subsequent year. EXHIBIT 45.3 | American Greetings Balance Sheet' (in millions of dollars) 2009 (Feb 2010) 2010 (Feb 2011) 2011E (Feb 2012) 138 216 136 120 180 Cash and Cash Equivalents Trade Accounts Receivable Inventories Prepaid Expenses Other Current Assets Total Current Assets 172 130 190 131 164 148 128 54 94 679 72 716 677 859 Net Property, plant, and Equipment and Other Assets Total Assets 850 1,529 832 1,547 1,536 0 0 87 87 Debt Due within One Year Accounts Payable Other Current Liabilities Current Liabilities 1 95 272 369 245 255 343 332 233 235 219 Long-Term Debt Other Liabilities Shareholders' Equity Total Liabilities and Shareholders' Equity 329 196 636 1,529 763 1,547 206 752 1,536 Data sources: Company accounts; management and case writer estimates. "Fiscal year ends February of subsequent year. EXHIBIT 45.8 Financial Forecast Assumptions Forecast Actual 2011 2012 2013 2014 2015 Bullish Scenario 5.3% 1.0% 2.0% 2.5% 9.4% Revenue Growth Operating Margin Net Working Capital Turnover Fixed Asset Turnover 1.5% 9.0% 6.50 1.95 9.0% 6.00 1.95 9.0% 7.00 9.0% 7.50 5.02 1.95 1.95 1.95 5.3% 0.0% 0.0% 0.0% Bearish Scenario Revenue Growth Operating Margin Net Working Capital Turnover Fixed Asset Turnover 9.4% 8.0% 5.02 1.95 0.0% 5.0% 7.50 1.95 7.0% 6.50 1.95 6.00 1.95 6.0% 7.00 1.95 Note: The ratios are defined in the following manner: Revenue Growth is the annual percentage change in total revenue, Operating Margin is operating income divided by total revenue, Net Working Capital Turnover is total revenue divided by net working capital where net working capital is current assets less current liabilities, Fixed Asset Turnover is total revenue divided by net PP&E and other assets. Data source: Case writer estimates