Answered step by step
Verified Expert Solution
Question
1 Approved Answer
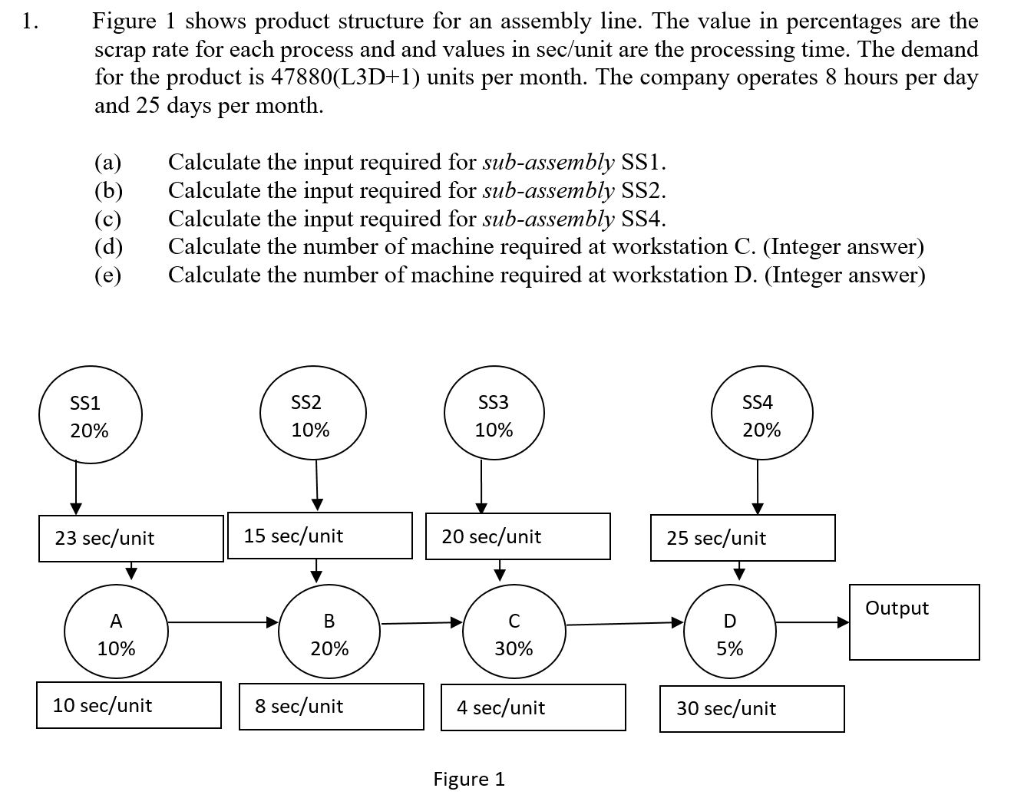
1. Figure 1 shows product structure for an assembly line. The value in percentages are the scrap rate for each process and and values

1. Figure 1 shows product structure for an assembly line. The value in percentages are the scrap rate for each process and and values in sec/unit are the processing time. The demand for the product is 47880(L3D+1) units per month. The company operates 8 hours per day and 25 days per month. (a) (b) (c) (d) (e) SS1 20% 23 sec/unit A 10% 10 sec/unit Calculate the input required for sub-assembly SS1. Calculate the input required for sub-assembly SS2. Calculate the input required for sub-assembly SS4. Calculate the number of machine required at workstation C. (Integer answer) Calculate the number of machine required at workstation D. (Integer answer) SS2 10% 15 sec/unit 20% 8 sec/unit SS3 10% 20 sec/unit C 30% 4 sec/unit Figure 1 SS4 20% 25 sec/unit D 5% 30 sec/unit Output
Step by Step Solution
★★★★★
3.48 Rating (174 Votes )
There are 3 Steps involved in it
Step: 1
first calculate the total demand per month in units Total demand per month 47880 L3D 1 Since the com...
Get Instant Access to Expert-Tailored Solutions
See step-by-step solutions with expert insights and AI powered tools for academic success
Step: 2

Step: 3

Ace Your Homework with AI
Get the answers you need in no time with our AI-driven, step-by-step assistance
Get Started


