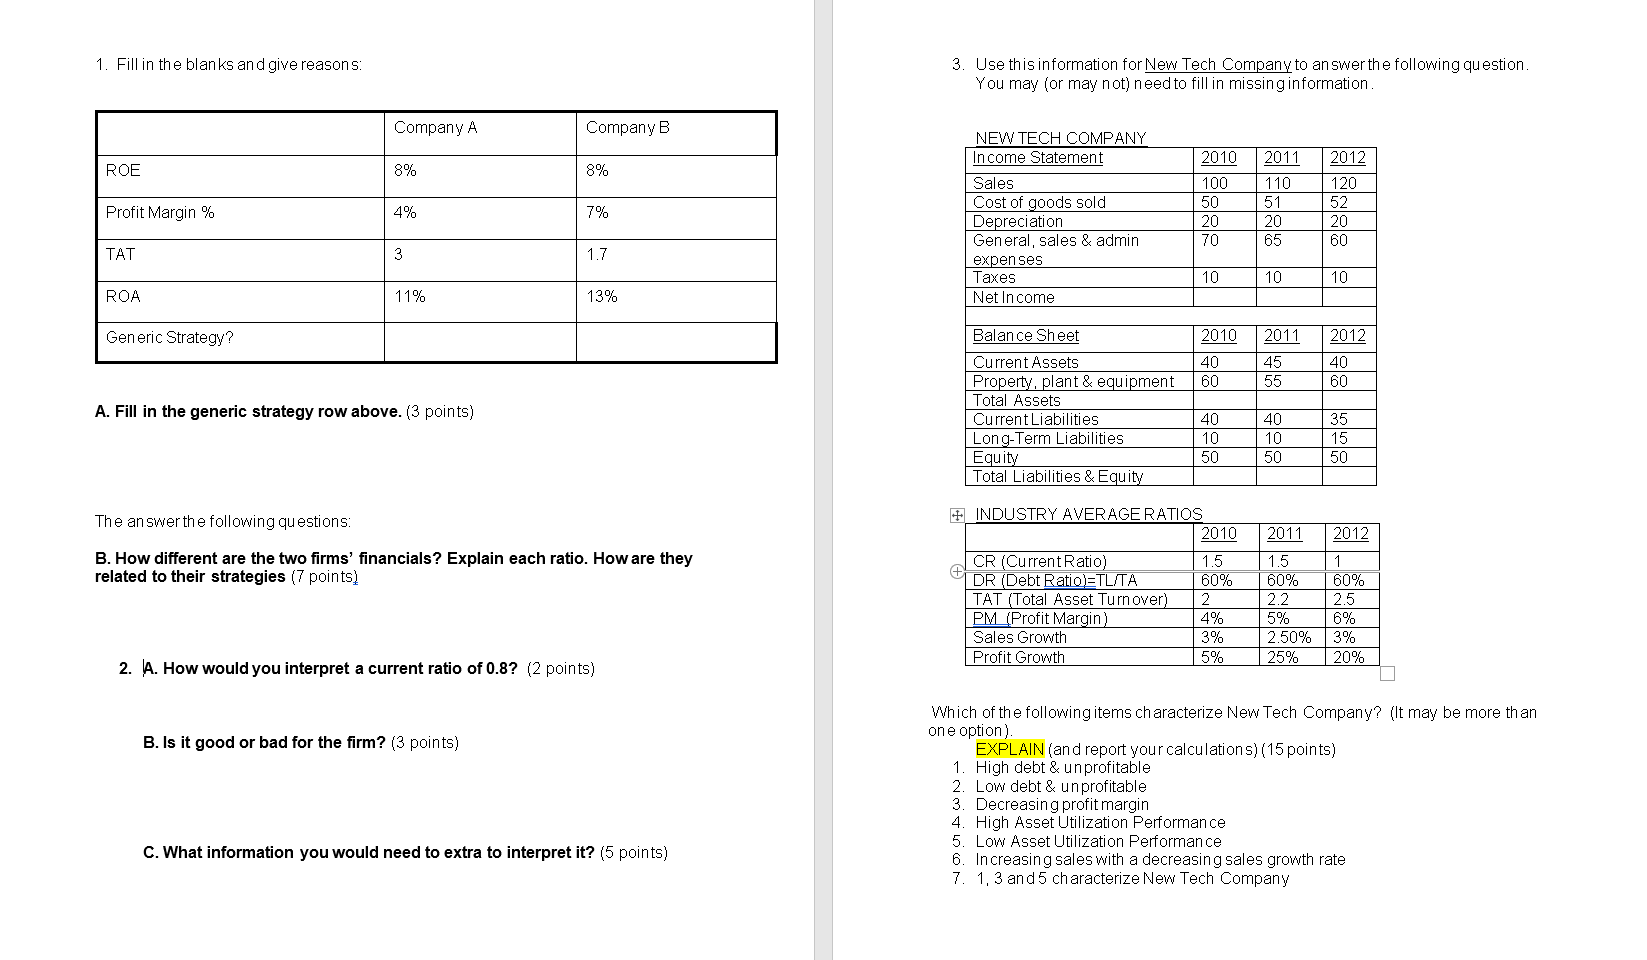
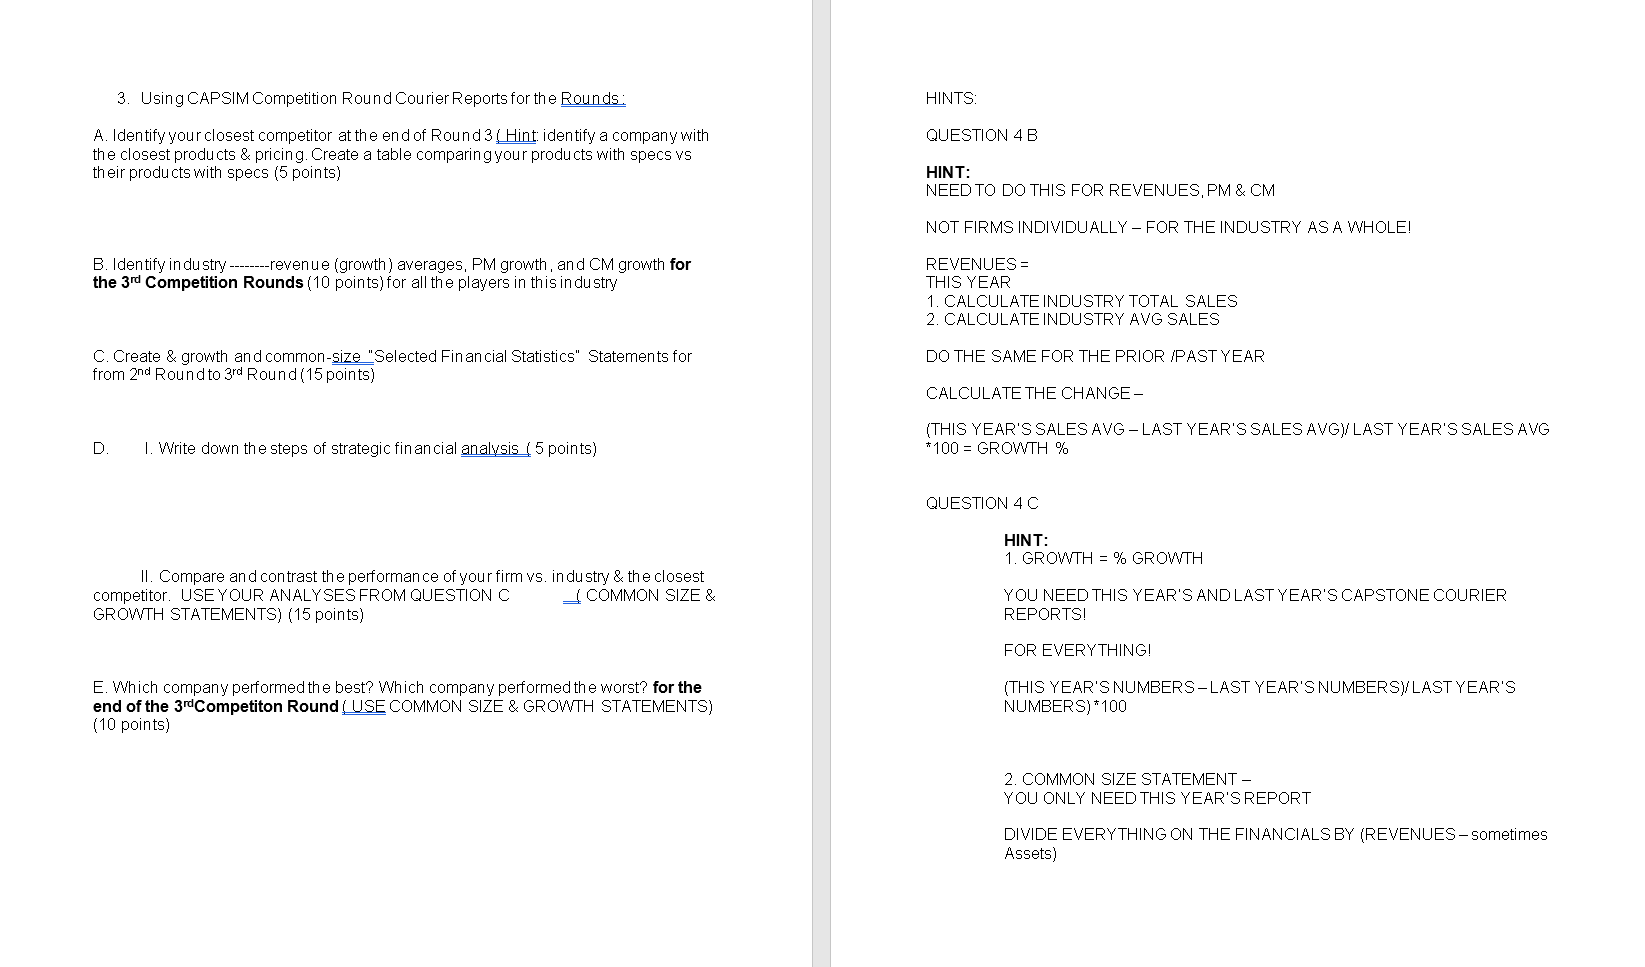
1. Fill in the blanks and give reasons: 3. Use this information for New Tech Company to answer the following question. You may or may not) need to fill in missing information. Company A Company B 2010 2011 ROE 8% 8% Profit Margin % 4% NEW TECH COMPANY Income Statement Sales Cost of goods sold Depreciation General, sales & admin expenses Taxes Net Income 2012 120 52 20 60 7% 100 50 20 70 110 51 20 65 TAT 3 1.7 10 10 10 ROA 11% 13% Generic Strategy? 2010 2011 2012 40 60 45 55 40 60 A. Fill in the generic strategy row above. (3 points) Balance Sheet Current Assets Property, plant & equipment Total Assets Current Liabilities Long-Term Liabilities Equity Total Liabilities & Equity 40 10 50 40 10 50 35 15 50 The answer the following questions: 2011 B. How different are the two firms' financials? Explain each ratio. How are they related to their strategies (7 points) + INDUSTRY AVERAGE RATIOS 2010 CR (Current Ratio) 1.5 + DR (Debt Ratio TL/TA 60% TAT (Total Asset Turnover) 2 PM (Profit Margin) 4% Sales Growth 3% Profit Growth 5% 1.5 60% 2.2 5% 2.50% 25% 2012 1 60% 2.5 6% 3% 20% 2. A. How would you interpret a current ratio of 0.8? (2 points) B. Is it good or bad for the firm? (3 points) Which of the following items characterize New Tech Company? (It may be more than one option). EXPLAIN (and report your calculations) (15 points) 1. High debt & unprofitable 2. Low debt & unprofitable 3. Decreasing profit margin 4. High Asset Utilization Performance 5. Low Asset Utilization Performance 6. Increasing sales with a decreasing sales growth rate 7. 1.3 and 5 characterize New Tech Company C. What information you would need to extra to interpret it? (5 points) 3. Using CAPSIM Competition Round Courier Reports for the Rounds: HINTS QUESTION 4 B A. Identify your closest competitor at the end of Round 3 (Hint identify a company with the closest products & pricing. Create a table comparing your products with specs vs their products with specs (5 points) HINT: NEED TO DO THIS FOR REVENUES, PM & CM NOT FIRMS INDIVIDUALLY FOR THE INDUSTRY AS A WHOLE! B. Identify in du stry --------revenue (growth) averages, PM growth, and CM growth for the 3rd Competition Rounds (10 points) for all the players in this industry REVENUES = THIS YEAR 1. CALCULATE INDUSTRY TOTAL SALES 2. CALCULATE INDUSTRY AVG SALES DO THE SAME FOR THE PRIOR /PAST YEAR C. Create & growth and common-size "Selected Financial Statistics" Statements for from 2nd Round to 3rd Round(15 points) CALCULATE THE CHANGE- (THIS YEAR'S SALES AVG-LAST YEAR'S SALES AVGY LAST YEAR'S SALES AVG *100 = GROWTH % D 1. Write down the steps of strategic financial analysis (5 points) QUESTION 4C HINT: 1. GROWTH = % GROWTH II. Compare and contrast the performance of your firm vs. industry & the closest competitor. USE YOUR ANALYSES FROM QUESTION C I COMMON SIZE & GROWTH STATEMENTS) (15 points) YOU NEED THIS YEAR'S AND LAST YEAR'S CAPSTONE COURIER REPORTS FOR EVERYTHING! E. Which company performed the best? Which company performed the worst? for the end of the 3rd Competiton Round (USE COMMON SIZE & GROWTH STATEMENTS) (10 points) (THIS YEAR'S NUMBERS-LAST YEAR'S NUMBERSY LAST YEAR'S NUMBERS)*100 2. COMMON SIZE STATEMENT YOU ONLY NEED THIS YEAR'S REPORT DIVIDE EVERYTHING ON THE FINANCIALS BY (REVENUES-sometimes Assets) 1. Fill in the blanks and give reasons: 3. Use this information for New Tech Company to answer the following question. You may or may not) need to fill in missing information. Company A Company B 2010 2011 ROE 8% 8% Profit Margin % 4% NEW TECH COMPANY Income Statement Sales Cost of goods sold Depreciation General, sales & admin expenses Taxes Net Income 2012 120 52 20 60 7% 100 50 20 70 110 51 20 65 TAT 3 1.7 10 10 10 ROA 11% 13% Generic Strategy? 2010 2011 2012 40 60 45 55 40 60 A. Fill in the generic strategy row above. (3 points) Balance Sheet Current Assets Property, plant & equipment Total Assets Current Liabilities Long-Term Liabilities Equity Total Liabilities & Equity 40 10 50 40 10 50 35 15 50 The answer the following questions: 2011 B. How different are the two firms' financials? Explain each ratio. How are they related to their strategies (7 points) + INDUSTRY AVERAGE RATIOS 2010 CR (Current Ratio) 1.5 + DR (Debt Ratio TL/TA 60% TAT (Total Asset Turnover) 2 PM (Profit Margin) 4% Sales Growth 3% Profit Growth 5% 1.5 60% 2.2 5% 2.50% 25% 2012 1 60% 2.5 6% 3% 20% 2. A. How would you interpret a current ratio of 0.8? (2 points) B. Is it good or bad for the firm? (3 points) Which of the following items characterize New Tech Company? (It may be more than one option). EXPLAIN (and report your calculations) (15 points) 1. High debt & unprofitable 2. Low debt & unprofitable 3. Decreasing profit margin 4. High Asset Utilization Performance 5. Low Asset Utilization Performance 6. Increasing sales with a decreasing sales growth rate 7. 1.3 and 5 characterize New Tech Company C. What information you would need to extra to interpret it? (5 points) 3. Using CAPSIM Competition Round Courier Reports for the Rounds: HINTS QUESTION 4 B A. Identify your closest competitor at the end of Round 3 (Hint identify a company with the closest products & pricing. Create a table comparing your products with specs vs their products with specs (5 points) HINT: NEED TO DO THIS FOR REVENUES, PM & CM NOT FIRMS INDIVIDUALLY FOR THE INDUSTRY AS A WHOLE! B. Identify in du stry --------revenue (growth) averages, PM growth, and CM growth for the 3rd Competition Rounds (10 points) for all the players in this industry REVENUES = THIS YEAR 1. CALCULATE INDUSTRY TOTAL SALES 2. CALCULATE INDUSTRY AVG SALES DO THE SAME FOR THE PRIOR /PAST YEAR C. Create & growth and common-size "Selected Financial Statistics" Statements for from 2nd Round to 3rd Round(15 points) CALCULATE THE CHANGE- (THIS YEAR'S SALES AVG-LAST YEAR'S SALES AVGY LAST YEAR'S SALES AVG *100 = GROWTH % D 1. Write down the steps of strategic financial analysis (5 points) QUESTION 4C HINT: 1. GROWTH = % GROWTH II. Compare and contrast the performance of your firm vs. industry & the closest competitor. USE YOUR ANALYSES FROM QUESTION C I COMMON SIZE & GROWTH STATEMENTS) (15 points) YOU NEED THIS YEAR'S AND LAST YEAR'S CAPSTONE COURIER REPORTS FOR EVERYTHING! E. Which company performed the best? Which company performed the worst? for the end of the 3rd Competiton Round (USE COMMON SIZE & GROWTH STATEMENTS) (10 points) (THIS YEAR'S NUMBERS-LAST YEAR'S NUMBERSY LAST YEAR'S NUMBERS)*100 2. COMMON SIZE STATEMENT YOU ONLY NEED THIS YEAR'S REPORT DIVIDE EVERYTHING ON THE FINANCIALS BY (REVENUES-sometimes Assets)