Answered step by step
Verified Expert Solution
Link Copied!

Question

1 Approved Answer

1. Fill in the calculations for sales revenue, total cost, and gross profit columns in the Data worksheet. 2. There are some typographical errors in

1. Fill in the calculations for sales revenue, total cost, and gross profit columns in the Data worksheet.

2. There are some typographical errors in the data set in the Region fields. Find and correct these errors by using a pivot table. Analyze sales revenue by inserting a pivot chart that shows the sales revenue trend by region over thefour-year period.

3. Analyze sales revenue, variable cost, and contribution margin for each year for each region using a pivot table.

image text in transcribed

image text in transcribed

B3 fx Intermountain A B C D E F H J K Intermountain Mid Atlantic International Great Plains Atlantic Northeast Pacific Northwest Gulf Coast Southwest Total of all regions 1 Segment Margin Report 2 For Year of 2018 3 4 Sales revenue 5 Less variable expenses 6 Contribution margin 7 Less direct fixed expenses 8 Segment margin 9 Less common fixed costs allocated to regions 10 Operating income (loss) 11 12 13 14 15 A B C D E F G H J 1 Fixed cost data 2 For year of 2018 3 4. Direct fixed expenses 5 Common allocated costs Intermountain Mid Atlantic International Great Plains Atlantic Northeast Pacific Northwest $ 6,132,428 $ 7,822,483 $ 712,540 $ 9,554,760 $ 4,023,981 $ 4,758,920 $ $ 1,149,223 $ 1,823,964 $ 225,630 $ 2,215,630 $ 844,620 $ 994,630 $ Gulf Coast 6,258,745 $ 920,761 $ Southwest 8,447,837 1,224,657 6 7 8 9 10 11 12 13 14 15 16 17 18 19 20 B3 fx Intermountain A B C D E F H J K Intermountain Mid Atlantic International Great Plains Atlantic Northeast Pacific Northwest Gulf Coast Southwest Total of all regions 1 Segment Margin Report 2 For Year of 2018 3 4 Sales revenue 5 Less variable expenses 6 Contribution margin 7 Less direct fixed expenses 8 Segment margin 9 Less common fixed costs allocated to regions 10 Operating income (loss) 11 12 13 14 15 A B C D E F G H J 1 Fixed cost data 2 For year of 2018 3 4. Direct fixed expenses 5 Common allocated costs Intermountain Mid Atlantic International Great Plains Atlantic Northeast Pacific Northwest $ 6,132,428 $ 7,822,483 $ 712,540 $ 9,554,760 $ 4,023,981 $ 4,758,920 $ $ 1,149,223 $ 1,823,964 $ 225,630 $ 2,215,630 $ 844,620 $ 994,630 $ Gulf Coast 6,258,745 $ 920,761 $ Southwest 8,447,837 1,224,657 6 7 8 9 10 11 12 13 14 15 16 17 18 19 20

Step by Step Solution

There are 3 Steps involved in it

Step: 1

blur-text-image

Get Instant Access to Expert-Tailored Solutions

See step-by-step solutions with expert insights and AI powered tools for academic success

Step: 2

blur-text-image

Step: 3

blur-text-image

Ace Your Homework with AI

Get the answers you need in no time with our AI-driven, step-by-step assistance

Get Started

Recommended Textbook for

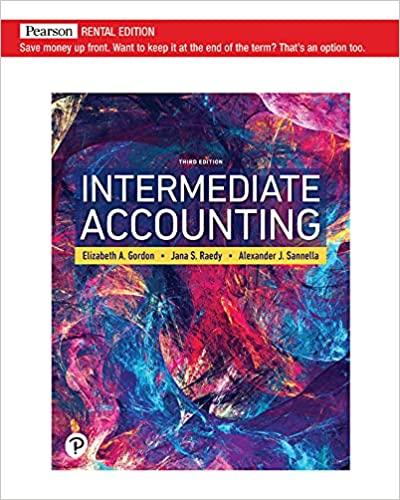
Intermediate Accounting

Authors: Elizabeth A. Gordon, Jana S. Raedy, Alexander J. Sannella

3rd Edition

0136946690, 978-0136946694

More Books

Students also viewed these Accounting questions