

Question
1. Financial analysis. Conduct a thorough financial analysis. Objectives The objectives of the financial analysis of a company in the case analysis are: 1. To
1. Financial analysis. Conduct a thorough financial analysis.
Objectives
The objectives of the financial analysis of a company in the case analysis are:
1. To establish the current financial health of the company using data provided in the case.
2. To use conclusions from the financial analysis as one of the metrics to establish whether the companys strategy has been a success.
3. To draw conclusions from the financial analysis about whether the financials rate a constraint on future strategic growth or whether the financials are a facilitator for enhancing future growth.
Analysis Format
Profitability, Liquidity, Leverage, and Activity ratios are important, especially the Current Ratio, and Debt-to-Equity ratio. Different industries have different activity ratios that are important, for example Retail inventory turnover, sales/square foot; Airlines cost/seat mile. Identify the activity ratio for the industry covered by the case. Other ratios that may be important: Dividend payout; P/E Some ratios are more relevant if you have the industry ratios.
Draw conclusions from the graphs. Remember some ratios are more important than others depending on the case. Undertake as many ratios as you can but be selective about which ones make the most sense given the potential issues in the case. You must provide detailed conclusions for your financial analysis and discuss what the strategic implications of these conclusions will have on the company.
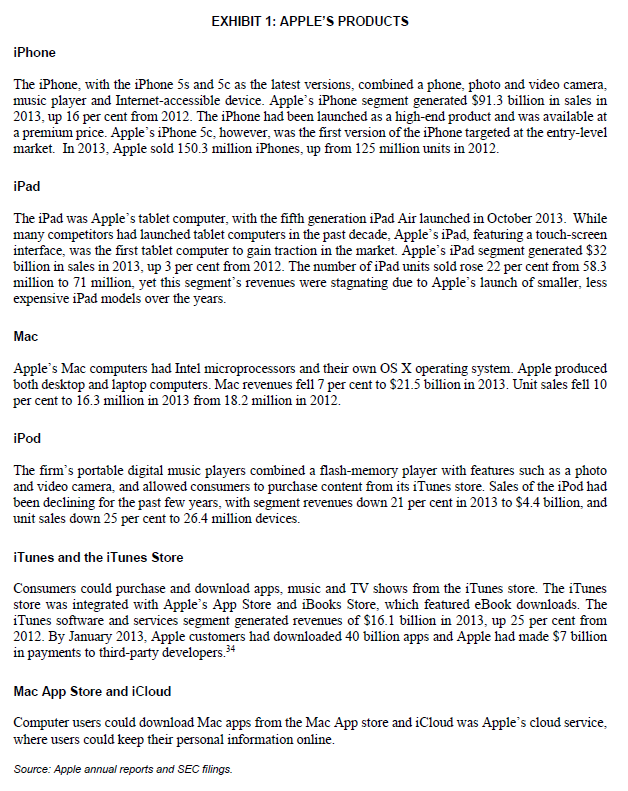
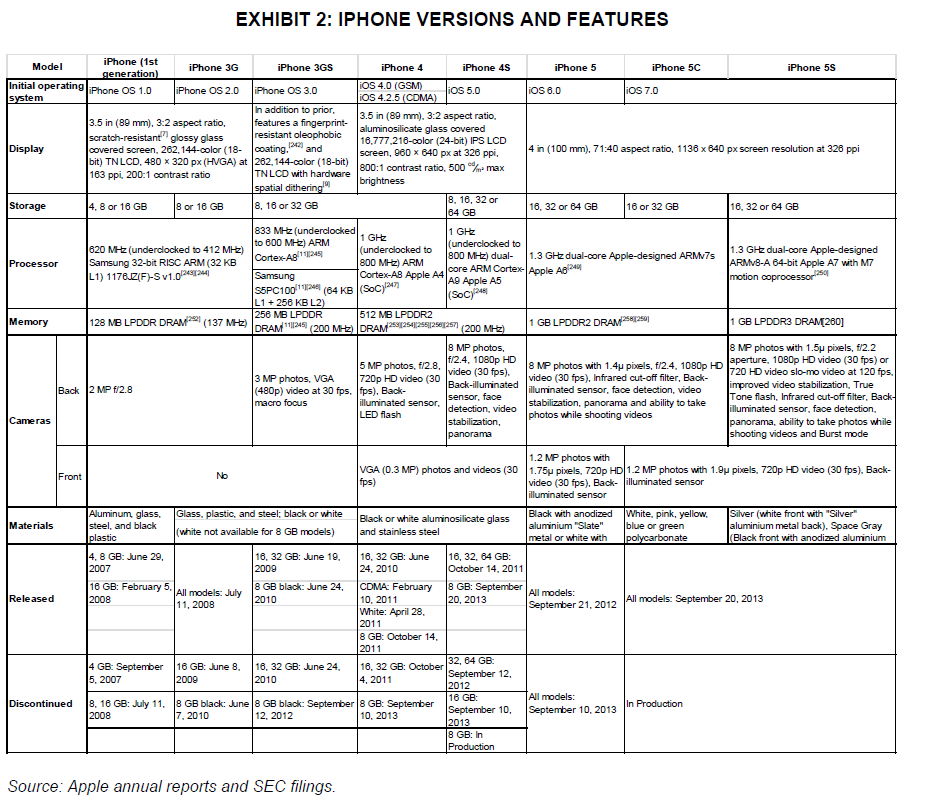
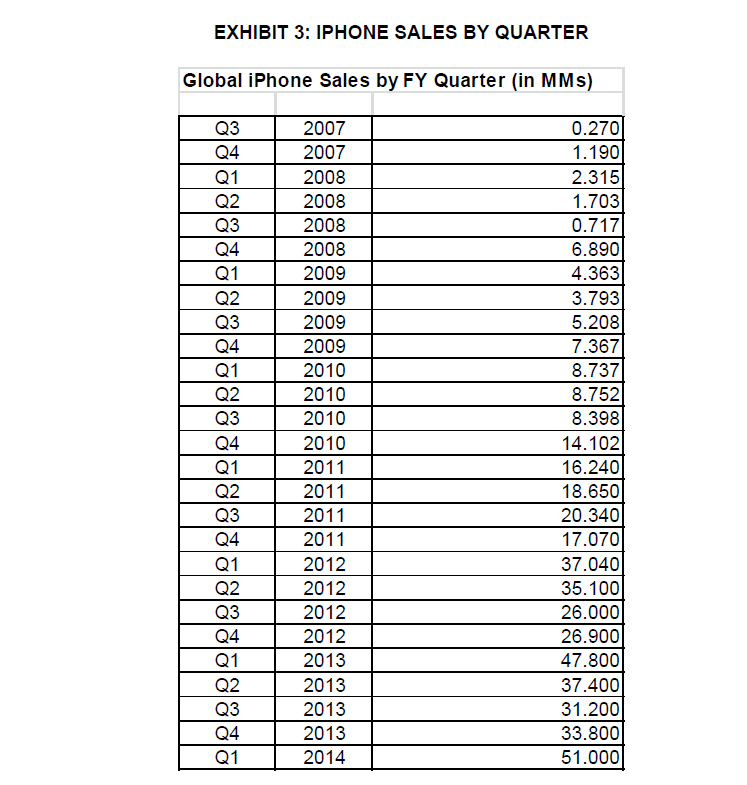
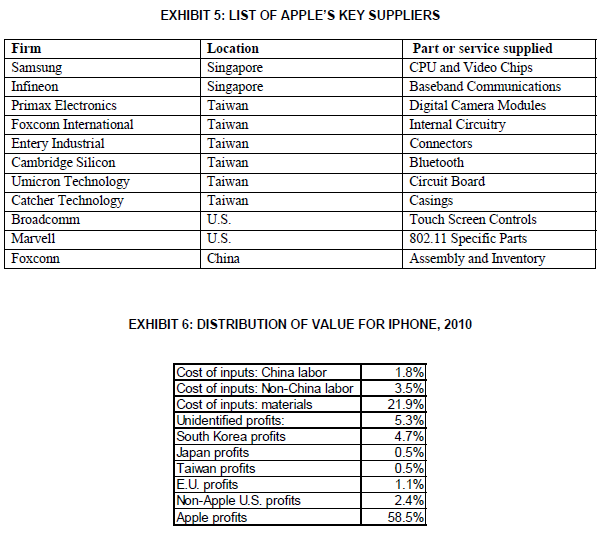
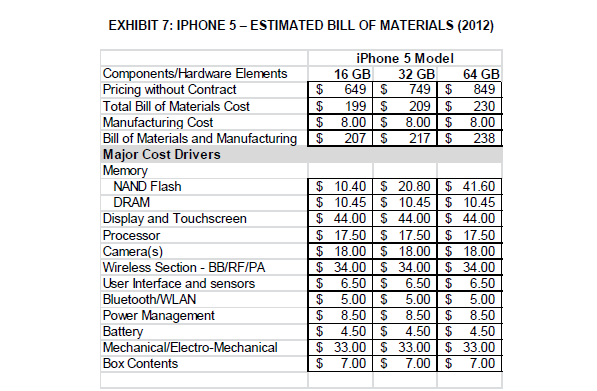
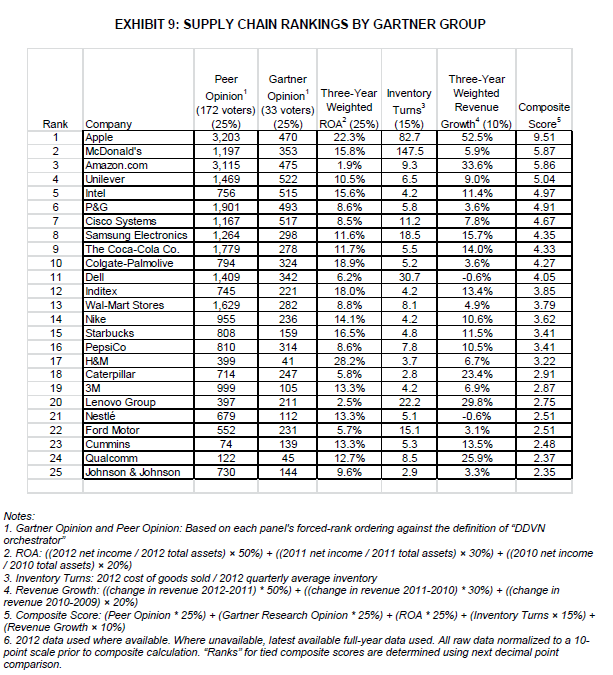
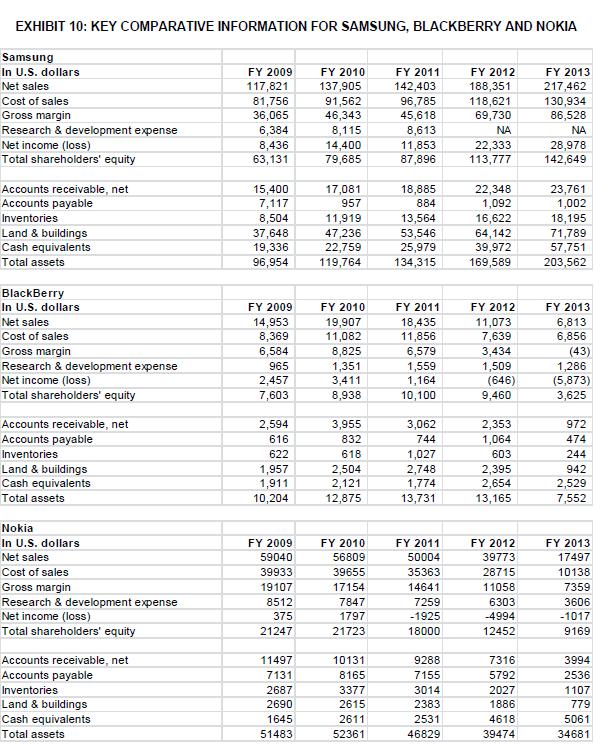
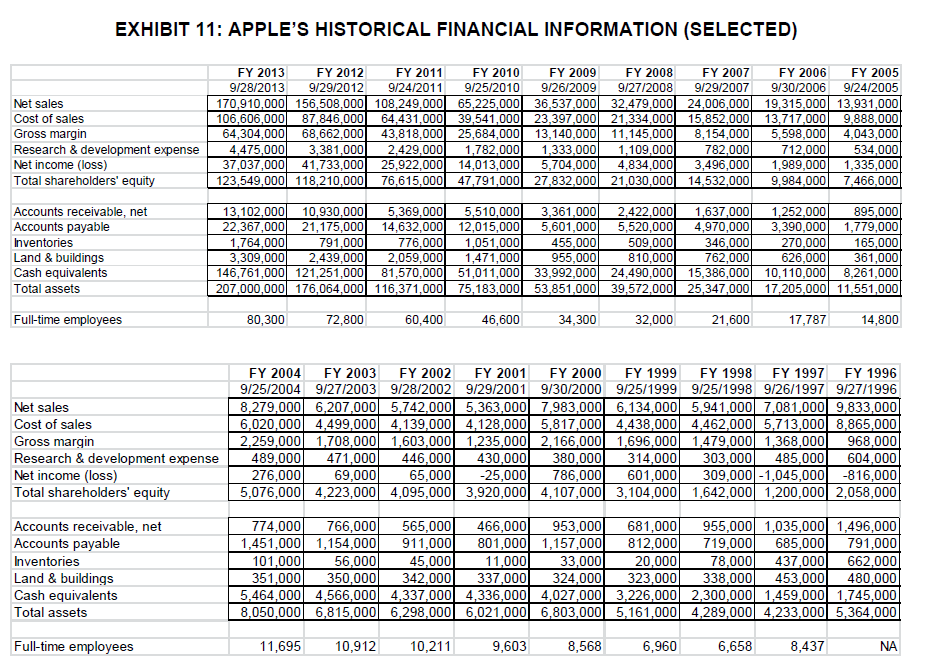
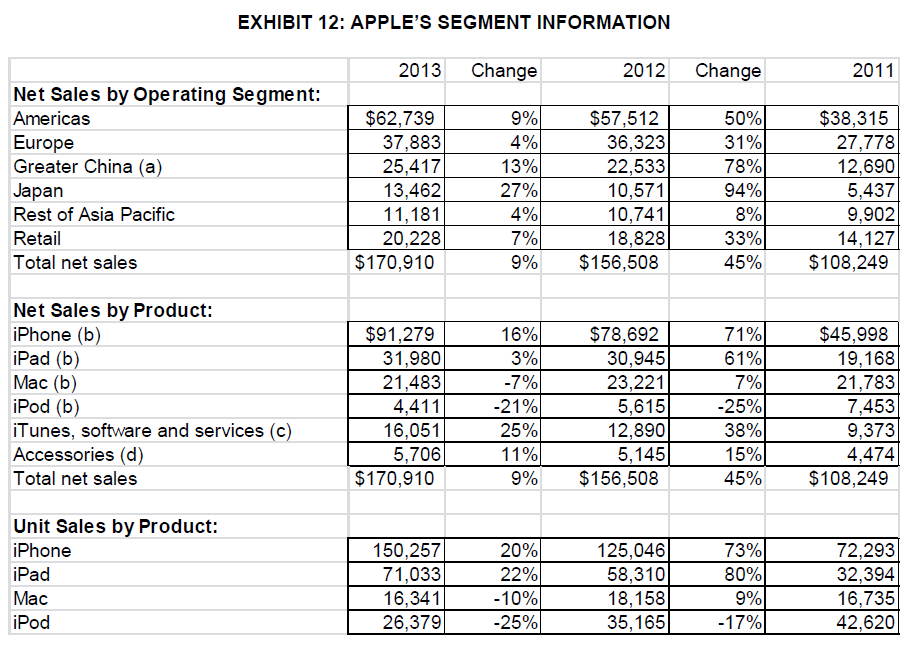
EXHIBIT 1: APPLE'S PRODUCTS iPhone The iPhone, with the iPhone 5s and 5c as the latest versions, combined a phone, photo and video camera, music player and Internet-accessible device. Apple's iPhone segment generated $91.3 billion in sales in 2013. up 16 per cent from 2012. The iPhone had been launched as a high-end product and was available at a premium price. Apple's iPhone 5c, however, was the first version of the iPhone targeted at the entry-level market. In 2013, Apple sold 150.3 million iPhones, up from 125 million units in 2012. iPad The iPad was Apple's tablet computer, with the fifth generation iPad Air launched in October 2013. While many competitors had launched tablet computers in the past decade. Apple's iPad, featuring a touch-screen interface, was the first tablet computer to gain traction in the market. Apple's iPad segment generated $32 billion in sales in 2013. up 3 per cent from 2012. The number of iPad units sold rose 22 per cent from 58.3 million to 71 million, yet this segment's revenues were stagnating due to Apple's launch of smaller, less expensive iPad models over the years. Mac Apple's Mac computers had Intel microprocessors and their own OS X operating system. Apple produced both desktop and laptop computers. Mac revenues fell 7 per cent to $21.5 billion in 2013. Unit sales fell 10 per cent to 16.3 million in 2013 from 18.2 million in 2012. iPod The firm's portable digital music players combined a flash-memory player with features such as a photo and video camera, and allowed consumers to purchase content from its iTunes store. Sales of the iPod had been declining for the past few years, with segment revenues down 21 per cent in 2013 to $4.4 billion, and unit sales down 25 per cent to 26.4 million devices. iTunes and the iTunes Store Consumers could purchase and download apps, music and TV shows from the iTunes store. The iTunes store was integrated with Apple's App Store and iBooks Store, which featured eBook downloads. The iTunes software and services segment generated revenues of $16.1 billion in 2013, up 25 per cent from 2012. By January 2013, Apple customers had downloaded 40 billion apps and Apple had made $7 billion in payments to third-party developers.34 Mac App Store and iCloud Computer users could download Mac apps from the Mac App store and iCloud was Apple's cloud service, where users could keep their personal information online. Source: Apple annual reports and SEC filings. EXHIBIT 2: IPHONE VERSIONS AND FEATURES iPhone 5C iPhone 5S iPhone 5 iOS 6.0 iOS 7.0 Model iPhone (1st iPhone 3G iPhone 3GS iPhone 4 iPhone 4S generation) Initial operating.Phone OS 1.0 iPhone OS 2.0 iPhone OS 3.0 IOS 4.0 (GSM) iOS 5.0 iOS 4.2.5 (CDMA) system In addition to prior, 3.5 in (89 mm), 3:2 aspect ratio, 3.5 in (89 mm). 3:2 aspect ratio, features a fingerprint- aluminosilicate glass covered scratch-resistant" glossy glass resistant oleophobic 16.777.216-color (24-bit) IPS LCD Display covered screen, 262.144-color (18- coating, and screen, 960 x 640 px at 326 ppi. bit) TN LCD. 480 x 320 px (HVGA) at 262.144-color (18-bit) 800:1 contrast ratio 500 %- max 163 ppi. 200:1 contrast ratio TN LCD with hardware brightness spatial dithering" 18. 16, 32 or Storage 4.8 or 16 GB 8 or 16 GB 8.18 or 32 GB 64 GB 4 in (100 mm), 71:40 aspect ratio, 1136 x 640 px screen resolution at 326 ppi 16, 32 or 64 GB 16 or 32 GB 16. 32 or 64 GB Cortex- A924 S5PC1001 (84 KB (Soc)247 Front 833 MHz (underclocked 1 GHz to 600 MHz) ARM 1G (underclocked to 620 MHz (underclocked to 412 MHz) (underclocked to 1.3 GHz dual-core Apple-designed 800 MHz) dual- Samsung 32-bit RISC ARM (32 KB Processor 1.3 GHz dual-core Apple-designed ARM75 800 MHz) ARM core ARM CortexApple A824 ARMv8-A 64-bit Apple A7 with M7 L1) 1176.Z/F)-S v1.04241 Samsung Cortex-A8 Apple A4 A9 Apple A5 motion coprocessors (SOC)/24 L1 + 256 KB L2) 256 MB LPDDR 512 MB LPDDR2 Memory 128 MB LPDDR DRAM (137 MHz) 111245 DRAM 1 GB LPDDR2 DRAM258259 1 GB LPDDR3 DRAM[260] 2532542552562571 (200 MHz) DRAM (200 MHz) 8 MP photos, 8 MP photos with 1.5 pixels, f/2.2 5 MP photos, f/2.8. f/2.4.1080p HD video (30 fps). 8 MP photos with 1.44 pixels, f/2.4, 1080p HD aperture 1080p HD video (30 fps) or 720 HD video slo-mo video at 120 fps. 3 MP photos, VGA 720p HD video (30 video (30 fps), Infrared cut-off filter, Back- Back-illuminated improved video stabilization, True Back 2 MP f/2.8 (480p) video at 30 fps. fps), Back- illuminated sensor, face detection, video macro focus illuminated sensor sensor, face Tone flash, Infrared cut-off filter, Back- detection, video stabilization, panorama and ability to take LED flash illuminated sensor, face detection, photos while shooting videos Cameras stabilization, panorama, ability to take photos while panorama shooting videos and Burst mode 1.2 MP photos with VGA (0.3 MP) photos and videos (30 1.75 pixels, 720p HD 1.2 MP photos with 1.9 pixels, 720p HD video (30 fps). Back- No fps) video (30 fps), Back-illuminated sensor illuminated sensor Aluminum, glass. Glass, plastic, and steel: black or white Black with anodized White, pink, yellow, Black or white aluminosilicate glass Silver (white front with "Silver" Materials steel, and black aluminium "Slate" blue or green aluminium metal back). Space Gray plastic (white not available for 8 GB models) and stainless steel metal or white with polycarbonate (Black front with anodized aluminium 4. 8 GB: June 29, 16.32 GB: June 10, 16.32 GB: June 16, 32, 64 GB 2007 2009 24. 2010 October 14, 2011 16 GB: February 5. All models: July 8 GB black: June 24, CDMA: February 8 GB: September All models: Released 2008 11, 2008 2010 10. 2011 20, 2013 All models: September 20, 2013 September 21, 2012 White: April 28. 2011 8 GB: October 14. 2011 32, 64 GB 4 GB: September 16 GB: June 8. 16, 32 GB: June 24, 16. 32 GB: October September 12, 5. 2007 2009 2010 4, 2011 2012 16 GB All models: Discontinued 8.16 GB: July 11. 8 GB black: June 8 GB black: September 8 GB: September In Production September 10, | 2008 7. 2010 September 10, 2013 12, 2012 10. 2013 2013 8 GB: In Production Source: Apple annual reports and SEC filings. EXHIBIT 3: IPHONE SALES BY QUARTER Global iPhone Sales by FY Quarter (in MMs) Q3 Q4 Q1 Q2 Q3 Q4 Q1 Q2 Q3 Q4 Q1 Q2 Q3 Q4 Q1 Q2 Q3 Q4 Q1 Q2 Q3 Q4 Q1 Q2 Q3 Q4 Q1 2007 2007 2008 2008 2008 2008 2009 2009 2009 2009 2010 2010 2010 2010 2011 2011 2011 2011 2012 2012 2012 2012 2013 2013 2013 2013 2014 0.270 1.190 2.315 1.703 0.717 6.890 4.363 3.793 5.208 7.367 8.737 8.752 8.398 14.102 16.240 18.650 20.340 17.070 37.040 35.100 26.000 26.900 47.800 37.400 31.200 33.800 51.000 EXHIBIT 5: LIST OF APPLE'S KEY SUPPLIERS Firm Samsung Infineon Primax Electronics Foxconn International Entery Industrial Cambridge Silicon Umicron Technology Catcher Technology Broadcomm Marvell Foxconn Location Singapore Singapore Taiwan Taiwan Taiwan Taiwan Taiwan Taiwan U.S. U.S. China Part or service supplied CPU and Video Chips Baseband Communications Digital Camera Modules Internal Circuitry Connectors Bluetooth Circuit Board Casings Touch Screen Controls 802.11 Specific Parts Assembly and Inventory EXHIBIT 6: DISTRIBUTION OF VALUE FOR IPHONE, 2010 Cost of inputs: China labor Cost of inputs: Non-China labor Cost of inputs: materials Unidentified profits: South Korea profits Japan profits Taiwan profits EU profits Non-Apple U.S. profits Apple profits 1.8% 3.5% 21.9% 5.3% 4.7% 0.5% 0.5% 1.1% 2.4% 58.5% EXHIBIT 7: IPHONE 5 - ESTIMATED BILL OF MATERIALS (2012) iPhone 5 Model Components/Hardware Elements 16 GB 32 GB 64 GB Pricing without Contract $ 649 $ 749 $ 849 Total Bill of Materials Cost $ 199 $ 209 $ 230 Manufacturing Cost $ 8.00 $ 8.00 $ 8.00 Bill of Materials and Manufacturing $ 207 $ 217$ 238 Major Cost Drivers Memory NAND Flash $ 10.40 $ 20.80 $ 41.60 DRAM $ 10.45 S 10.45 $ 10.45 Display and Touchscreen $ 44.00 $ 44.00 $ 44.00 Processor $ 17.50 $ 17.50 $ 17.50 Camera(s) $ 18.00 S 18.00 $ 18.00 Wireless Section - BB/RF/PA $ 34.00 S 34.00 $ 34.00 User Interface and sensors $ 6.50 $ 6.50 $ 6.50 Bluetooth/WLAN $ 5.00 $ 5.00 $ 5.00 Power Management $ 8.50 $ 8.50 $ 8.50 Battery $ 4.50 $ 4.50 $ 4.50 Mechanical/Electro-Mechanical $ 33.00$ 33.00 $ 33.00 Box Contents $ 7.00 $ 7.00 $ 7.00 EXHIBIT 9: SUPPLY CHAIN RANKINGS BY GARTNER GROUP Rank 1 2 3 4 5 6 7 8 9 10 11 12 13 14 15 16 17 18 19 20 21 22 23 24 25 Company Apple McDonald's Amazon.com Unilever Intel P&G Cisco Systems Samsung Electronics The Coca-Cola Co. Colgate-Palmolive Dell Inditex Wal-Mart Stores Nike Starbucks PepsiCo H&M Caterpillar 3M Lenovo Group Nestl Ford Motor Cummins Qualcomm Johnson & Johnson Peer Gartner Opinion Opinion' Three-Year Inventory (172 voters) (33 voters) Weighted Tums (25%) (25%) ROA (25%) (15%) 3,203 470 22.3% 82.7 1,197 353 15.8% 147.5 3,115 475 1.9% 9.3 1,469 522 10.5% 6.5 756 515 15.6% 4.2 1,901 493 8.6% 5.8 1,167 517 8.5% 11.2 1,264 298 11.6% 18.5 1,779 278 11.7% 5.5 794 324 18.9% 5.2 1,409 342 6.2% 30.7 745 221 18.0% 4.2 1,629 282 8.8% 8.1 955 236 14.1% 4.2 808 159 16.5% 4.8 810 314 8.6% 7.8 399 41 28.2% 3.7 714 247 5.8% 2.8 999 105 13.3% 4.2 397 211 2.5% 22.2 679 112 13.3% 5.1 552 231 5.7% 15.1 74 139 13.3% 5.3 122 45 12.7% 8.5 730 144 9.6% 2.9 Three-Year Weighted Revenue Growth (10%) 52.5% 5.9% 33.6% 9.0% 11.4% 3.6% 7.8% 15.7% 14.0% 3.6% -0.6% 13.4% 4.9% 10.6% 11.5% 10.5% 6.7% 23.4% 6.9% 29.8% -0.6% 3.1% 13.5% 25.9% 3.3% Composite Score 9.51 5.87 5.86 5.04 4.97 4.91 4.67 4.35 4.33 4.27 4.05 3.85 3.79 3.62 3.41 3.41 3.22 2.91 2.87 2.75 2.51 2.51 2.48 2.37 2.35 Notes: 1. Gartner Opinion and Peer Opinion: Based on each panel's forced-rank ordering against the definition of "DDVN orchestrator" 2. ROA: ((2012 net income / 2012 total assets) * 50%) + ((2011 net income / 2011 total assets) * 30%) + ((2010 net income /2010 total assets) * 20%) 3. Inventory Turns: 2012 cost of goods sold / 2012 quarterly average inventory 4. Revenue Growth: ((change in revenue 2012-2011) * 50%) + ((change in revenue 2011-2010) * 30%) + ((change in revenue 2010-2009) 20%) 5. Composite Score: (Peer Opinion * 25%) + (Gartner Research Opinion * 25%) + (ROA * 25%) + (Inventory Turns * 15%) + (Revenue Growth * 10%) 6. 2012 data used where available. Where unavailable, latest available full-year data used. All raw data normalized to a 10- point scale prior to composite calculation. "Ranks for tied composite scores are determined using next decimal point comparison EXHIBIT 10: KEY COMPARATIVE INFORMATION FOR SAMSUNG, BLACKBERRY AND NOKIA Samsung In U.S. dollars Net sales Cost of sales Gross margin Research & development expense Net income (loss) Total shareholders' equity FY 2009 117,821 81,756 36,065 6,384 8,436 63,131 FY 2010 137,905 91,562 46,343 8,115 14,400 79,685 FY 2011 142,403 96,785 45,618 8,613 11,853 87,896 FY 2012 188,351 118,621 69,730 NA 22,333 113,777 FY 2013 217,462 130,934 86,528 NA 28,978 142,649 Accounts receivable, net Accounts payable Inventories Land & buildings Cash equivalents Total assets 15,400 7,117 8,504 37,648 19,336 96,954 17,081 957 11,919 47,236 22,759 119,764 18,885 884 13,564 53,546 25,979 134,315 22,348 1,092 16,622 64,142 39,972 169,589 23,761 1,002 18,195 71,789 57,751 203,562 BlackBerry In U.S. dollars Net sales Cost of sales Gross margin Research & development expense Net income (loss) Total shareholders' equity FY 2009 14,953 8,369 6,584 965 2,457 7,603 FY 2010 19,907 11,082 8,825 1,351 3,411 8,938 FY 2011 18,435 11,856 6,579 1,559 1,164 10,100 FY 2012 11,073 7,639 3,434 1,509 (646) 9,460 FY 2013 6,813 6,856 (43) 1,286 (5,873) 3,625 Accounts receivable, net Accounts payable Inventories Land & buildings Cash equivalents Total assets 2,594 616 622 1,957 1,911 10,204 3,955 832 618 2,504 2,121 12,875 3,062 744 1,027 2,748 1,774 13,731 2,353 1,064 603 2,395 2,654 13,165 972 474 244 942 2,529 7,552 Nokia In U.S. dollars Net sales Cost of sales Gross margin Research & development expense Net income (loss) Total shareholders' equity Accounts receivable, net Accounts payable Inventories Land & buildings Cash equivalents Total assets FY 2009 59040 39933 19107 8512 375 21247 FY 2010 56809 39655 17154 7847 1797 21723 FY 2011 50004 35363 14641 7259 -1925 18000 FY 2012 39773 28715 11058 6303 -4994 12452 FY 2013 17497 10138 7359 3606 -1017 9169 11497 7131 2687 2690 1645 51483 10131 8165 3377 2615 2611 52361 9288 7155 3014 2383 2531 46829 7316 5792 2027 1886 4618 39474 3994 2536 1107 779 5061 34681 EXHIBIT 11: APPLE'S HISTORICAL FINANCIAL INFORMATION (SELECTED) Net sales Cost of sales Gross margin Research & development expense Net income (loss) Total shareholders' equity FY 2013 FY 2012 FY 2011 FY 2010 FY 2009 FY 2008 FY 2007 FY 2006 FY 2005 9/28/2013 9/29/2012 9/24/2011 9/25/2010 9/26/2009 9/27/2008 9/29/2007 9/30/2006 9/24/2005 170,910,000 156,508,000 108,249,000 65,225,000 36,537,000 32,479,000 24,006,000 19,315,000 13.931,000 106,606,000 87,846,000 64,431,000 39,541,000 23,397,000 21,334,000 15,852,000 13,717,000 9.888,000 64,304,000 68,662.000 43,818,000 25,684,000 13,140,000 11,145,000 8,154,000 5,598,000 4,043,000 4,475,000 3,381,000 2.429,000 1,782,000 1,333,000 1,109,000 782,000 712,000 534,000 37,037,000 41,733,000 25,922,000 14,013,000 5,704,000 4,834,000 3,496,000 1,989,000 1,335,000 123,549,000 118,210,000 76,615,000 47,791,000 27,832,000 21.030,000 14,532,000 9,984,000 7,466,000 Accounts receivable, net Accounts payable Inventories Land & buildings Cash equivalents Total assets 13,102,000 10,930,000! 5,369,000 5,510,000 3,361,000 2.422.000 1,637,0001 1,252,000 895,000 22,367,000 21,175,000 14,632,000 12,015,000 5,601,000 5,520,000 4,970,000 3,390,000 1,779,000 1,764,000 791,000 776,000 1,051,000 455,000 509,000 346,000 270,000 165,000 3,309,000 2,439,000 2,059,000 1,471,000 955,000 810,000 762,000 626,000 361,000 146,761,000 121,251,000 81,570,000 51,011,000 33,992,000 24,490,000 15,386,000 10,110,000 8,261,000 207,000,000 176,064,000 116,371.000 75.183.000 53.851,000 39,572,000 25,347,000 17,205,000 11,551,000 Full-time employees 80,300 72,800 60,400 46,600 34,300 32,000 21,600 17,787 14,800 Net sales Cost of sales Gross margin Research & development expense Net income (loss) Total shareholders' equity FY 2004 FY 2003 FY 2002 FY 2001 FY 2000 FY 1999 FY 1998 FY 1997 FY 1996 9/25/2004 9/27/2003 9/28/2002 9/29/2001 9/30/2000 9/25/1999 9/25/1998 9/26/1997 9/27/1996 8,279,000 6,207,000 5,742,000 5,363,000 7,983,000 6,134,000 5,941,000 7,081,000 9,833,000 6,020,000 4,499,000 4,139,000 4,128,000 5,817,000 4,438,000 4,462,000 5,713,000 8,865,000 2,259,000 1,708,000 1,603,000 1,235,000 2,166,000 1,696,000 1,479,000 1,368,000 968,000 489,000 471,000 446,000 430,000 380,000 314,000 303,000 485.000 604,000 276,000 69,000 65,000 -25,000 786,000 601,000 309,000 -1,045,000 -816,000 5,076,000 4,223,000 4,095,000 3,920,000 4,107,000 3,104,000 1,642,000 1,200,000 2,058,000 Accounts receivable, net Accounts payable Inventories Land & buildings Cash equivalents Total assets 774,000 766,000 565,000 466,000 953,000 681,000 955,000 1,035,000 1,496,000 1,451,000 1,154,000 911,000 801,000 1,157,000 812,000 719,000 685,000 791,000 101,000 56,000 45,000 11,000 33,000 20.000 78,000 437,000 662,000 351,000 350,000 342.000 337,000 324,000 323,000 338,000 453,000 480,000 5,464,000 4,566,000 4,337,000 4,336,000 4,027,000 3,226,000 2,300,000 1,459,000 1,745,000 8,050,000 6,815,000 6,298,000 6,021,000 6.803,000 5,161,000 4,289,000 4,233,000 5,364,000 Full-time employees 11,695 10,912 10,211 9,603 8,568 6,960 6,658 8,437 NA EXHIBIT 12: APPLE'S SEGMENT INFORMATION 2013 Change 2012 Change 2011 Net Sales by Operating Segment: Americas Europe Greater China (a) Japan Rest of Asia Pacific Retail Total net sales $62,739 37,883 25,417 13,462 11,181 20,228 $170,910 9% 4% 13% 27% 4% 7% 9% $57,512 36,323 22,533 10,571 10,741 18,828 $156,508 50% 31% 78% 94% 8% 33% 45% $38,315 27,778 12,690 5,437 9,902 14,127 $108,249 Net Sales by Product: iPhone (b) iPad (b) Mac (b) iPod (b) iTunes, software and services (c) Accessories (d) Total net sales $91,279 31,980 21,483 4,411 16,051 5,706 $170,910 16% 3% -7% -21% 25% 11% 9% $78,692 30,945 23,221 5,615 12,890 5,145 $156,508 71% 61% 7% -25% 38% 15% 45% $45,998 19,168 21,783 7,453 9,373 4,474 $108,249 Unit Sales by Product: iPhone iPad Mac iPod 150,257 71,033 16,341 26,379 20% 22% -10% -25% 125,046 58,310 18,158 35,165 73% 80% 9% -17% 72.293 32,394 16,735 42,620 EXHIBIT 1: APPLE'S PRODUCTS iPhone The iPhone, with the iPhone 5s and 5c as the latest versions, combined a phone, photo and video camera, music player and Internet-accessible device. Apple's iPhone segment generated $91.3 billion in sales in 2013. up 16 per cent from 2012. The iPhone had been launched as a high-end product and was available at a premium price. Apple's iPhone 5c, however, was the first version of the iPhone targeted at the entry-level market. In 2013, Apple sold 150.3 million iPhones, up from 125 million units in 2012. iPad The iPad was Apple's tablet computer, with the fifth generation iPad Air launched in October 2013. While many competitors had launched tablet computers in the past decade. Apple's iPad, featuring a touch-screen interface, was the first tablet computer to gain traction in the market. Apple's iPad segment generated $32 billion in sales in 2013. up 3 per cent from 2012. The number of iPad units sold rose 22 per cent from 58.3 million to 71 million, yet this segment's revenues were stagnating due to Apple's launch of smaller, less expensive iPad models over the years. Mac Apple's Mac computers had Intel microprocessors and their own OS X operating system. Apple produced both desktop and laptop computers. Mac revenues fell 7 per cent to $21.5 billion in 2013. Unit sales fell 10 per cent to 16.3 million in 2013 from 18.2 million in 2012. iPod The firm's portable digital music players combined a flash-memory player with features such as a photo and video camera, and allowed consumers to purchase content from its iTunes store. Sales of the iPod had been declining for the past few years, with segment revenues down 21 per cent in 2013 to $4.4 billion, and unit sales down 25 per cent to 26.4 million devices. iTunes and the iTunes Store Consumers could purchase and download apps, music and TV shows from the iTunes store. The iTunes store was integrated with Apple's App Store and iBooks Store, which featured eBook downloads. The iTunes software and services segment generated revenues of $16.1 billion in 2013, up 25 per cent from 2012. By January 2013, Apple customers had downloaded 40 billion apps and Apple had made $7 billion in payments to third-party developers.34 Mac App Store and iCloud Computer users could download Mac apps from the Mac App store and iCloud was Apple's cloud service, where users could keep their personal information online. Source: Apple annual reports and SEC filings. EXHIBIT 2: IPHONE VERSIONS AND FEATURES iPhone 5C iPhone 5S iPhone 5 iOS 6.0 iOS 7.0 Model iPhone (1st iPhone 3G iPhone 3GS iPhone 4 iPhone 4S generation) Initial operating.Phone OS 1.0 iPhone OS 2.0 iPhone OS 3.0 IOS 4.0 (GSM) iOS 5.0 iOS 4.2.5 (CDMA) system In addition to prior, 3.5 in (89 mm), 3:2 aspect ratio, 3.5 in (89 mm). 3:2 aspect ratio, features a fingerprint- aluminosilicate glass covered scratch-resistant" glossy glass resistant oleophobic 16.777.216-color (24-bit) IPS LCD Display covered screen, 262.144-color (18- coating, and screen, 960 x 640 px at 326 ppi. bit) TN LCD. 480 x 320 px (HVGA) at 262.144-color (18-bit) 800:1 contrast ratio 500 %- max 163 ppi. 200:1 contrast ratio TN LCD with hardware brightness spatial dithering" 18. 16, 32 or Storage 4.8 or 16 GB 8 or 16 GB 8.18 or 32 GB 64 GB 4 in (100 mm), 71:40 aspect ratio, 1136 x 640 px screen resolution at 326 ppi 16, 32 or 64 GB 16 or 32 GB 16. 32 or 64 GB Cortex- A924 S5PC1001 (84 KB (Soc)247 Front 833 MHz (underclocked 1 GHz to 600 MHz) ARM 1G (underclocked to 620 MHz (underclocked to 412 MHz) (underclocked to 1.3 GHz dual-core Apple-designed 800 MHz) dual- Samsung 32-bit RISC ARM (32 KB Processor 1.3 GHz dual-core Apple-designed ARM75 800 MHz) ARM core ARM CortexApple A824 ARMv8-A 64-bit Apple A7 with M7 L1) 1176.Z/F)-S v1.04241 Samsung Cortex-A8 Apple A4 A9 Apple A5 motion coprocessors (SOC)/24 L1 + 256 KB L2) 256 MB LPDDR 512 MB LPDDR2 Memory 128 MB LPDDR DRAM (137 MHz) 111245 DRAM 1 GB LPDDR2 DRAM258259 1 GB LPDDR3 DRAM[260] 2532542552562571 (200 MHz) DRAM (200 MHz) 8 MP photos, 8 MP photos with 1.5 pixels, f/2.2 5 MP photos, f/2.8. f/2.4.1080p HD video (30 fps). 8 MP photos with 1.44 pixels, f/2.4, 1080p HD aperture 1080p HD video (30 fps) or 720 HD video slo-mo video at 120 fps. 3 MP photos, VGA 720p HD video (30 video (30 fps), Infrared cut-off filter, Back- Back-illuminated improved video stabilization, True Back 2 MP f/2.8 (480p) video at 30 fps. fps), Back- illuminated sensor, face detection, video macro focus illuminated sensor sensor, face Tone flash, Infrared cut-off filter, Back- detection, video stabilization, panorama and ability to take LED flash illuminated sensor, face detection, photos while shooting videos Cameras stabilization, panorama, ability to take photos while panorama shooting videos and Burst mode 1.2 MP photos with VGA (0.3 MP) photos and videos (30 1.75 pixels, 720p HD 1.2 MP photos with 1.9 pixels, 720p HD video (30 fps). Back- No fps) video (30 fps), Back-illuminated sensor illuminated sensor Aluminum, glass. Glass, plastic, and steel: black or white Black with anodized White, pink, yellow, Black or white aluminosilicate glass Silver (white front with "Silver" Materials steel, and black aluminium "Slate" blue or green aluminium metal back). Space Gray plastic (white not available for 8 GB models) and stainless steel metal or white with polycarbonate (Black front with anodized aluminium 4. 8 GB: June 29, 16.32 GB: June 10, 16.32 GB: June 16, 32, 64 GB 2007 2009 24. 2010 October 14, 2011 16 GB: February 5. All models: July 8 GB black: June 24, CDMA: February 8 GB: September All models: Released 2008 11, 2008 2010 10. 2011 20, 2013 All models: September 20, 2013 September 21, 2012 White: April 28. 2011 8 GB: October 14. 2011 32, 64 GB 4 GB: September 16 GB: June 8. 16, 32 GB: June 24, 16. 32 GB: October September 12, 5. 2007 2009 2010 4, 2011 2012 16 GB All models: Discontinued 8.16 GB: July 11. 8 GB black: June 8 GB black: September 8 GB: September In Production September 10, | 2008 7. 2010 September 10, 2013 12, 2012 10. 2013 2013 8 GB: In Production Source: Apple annual reports and SEC filings. EXHIBIT 3: IPHONE SALES BY QUARTER Global iPhone Sales by FY Quarter (in MMs) Q3 Q4 Q1 Q2 Q3 Q4 Q1 Q2 Q3 Q4 Q1 Q2 Q3 Q4 Q1 Q2 Q3 Q4 Q1 Q2 Q3 Q4 Q1 Q2 Q3 Q4 Q1 2007 2007 2008 2008 2008 2008 2009 2009 2009 2009 2010 2010 2010 2010 2011 2011 2011 2011 2012 2012 2012 2012 2013 2013 2013 2013 2014 0.270 1.190 2.315 1.703 0.717 6.890 4.363 3.793 5.208 7.367 8.737 8.752 8.398 14.102 16.240 18.650 20.340 17.070 37.040 35.100 26.000 26.900 47.800 37.400 31.200 33.800 51.000 EXHIBIT 5: LIST OF APPLE'S KEY SUPPLIERS Firm Samsung Infineon Primax Electronics Foxconn International Entery Industrial Cambridge Silicon Umicron Technology Catcher Technology Broadcomm Marvell Foxconn Location Singapore Singapore Taiwan Taiwan Taiwan Taiwan Taiwan Taiwan U.S. U.S. China Part or service supplied CPU and Video Chips Baseband Communications Digital Camera Modules Internal Circuitry Connectors Bluetooth Circuit Board Casings Touch Screen Controls 802.11 Specific Parts Assembly and Inventory EXHIBIT 6: DISTRIBUTION OF VALUE FOR IPHONE, 2010 Cost of inputs: China labor Cost of inputs: Non-China labor Cost of inputs: materials Unidentified profits: South Korea profits Japan profits Taiwan profits EU profits Non-Apple U.S. profits Apple profits 1.8% 3.5% 21.9% 5.3% 4.7% 0.5% 0.5% 1.1% 2.4% 58.5% EXHIBIT 7: IPHONE 5 - ESTIMATED BILL OF MATERIALS (2012) iPhone 5 Model Components/Hardware Elements 16 GB 32 GB 64 GB Pricing without Contract $ 649 $ 749 $ 849 Total Bill of Materials Cost $ 199 $ 209 $ 230 Manufacturing Cost $ 8.00 $ 8.00 $ 8.00 Bill of Materials and Manufacturing $ 207 $ 217$ 238 Major Cost Drivers Memory NAND Flash $ 10.40 $ 20.80 $ 41.60 DRAM $ 10.45 S 10.45 $ 10.45 Display and Touchscreen $ 44.00 $ 44.00 $ 44.00 Processor $ 17.50 $ 17.50 $ 17.50 Camera(s) $ 18.00 S 18.00 $ 18.00 Wireless Section - BB/RF/PA $ 34.00 S 34.00 $ 34.00 User Interface and sensors $ 6.50 $ 6.50 $ 6.50 Bluetooth/WLAN $ 5.00 $ 5.00 $ 5.00 Power Management $ 8.50 $ 8.50 $ 8.50 Battery $ 4.50 $ 4.50 $ 4.50 Mechanical/Electro-Mechanical $ 33.00$ 33.00 $ 33.00 Box Contents $ 7.00 $ 7.00 $ 7.00 EXHIBIT 9: SUPPLY CHAIN RANKINGS BY GARTNER GROUP Rank 1 2 3 4 5 6 7 8 9 10 11 12 13 14 15 16 17 18 19 20 21 22 23 24 25 Company Apple McDonald's Amazon.com Unilever Intel P&G Cisco Systems Samsung Electronics The Coca-Cola Co. Colgate-Palmolive Dell Inditex Wal-Mart Stores Nike Starbucks PepsiCo H&M Caterpillar 3M Lenovo Group Nestl Ford Motor Cummins Qualcomm Johnson & Johnson Peer Gartner Opinion Opinion' Three-Year Inventory (172 voters) (33 voters) Weighted Tums (25%) (25%) ROA (25%) (15%) 3,203 470 22.3% 82.7 1,197 353 15.8% 147.5 3,115 475 1.9% 9.3 1,469 522 10.5% 6.5 756 515 15.6% 4.2 1,901 493 8.6% 5.8 1,167 517 8.5% 11.2 1,264 298 11.6% 18.5 1,779 278 11.7% 5.5 794 324 18.9% 5.2 1,409 342 6.2% 30.7 745 221 18.0% 4.2 1,629 282 8.8% 8.1 955 236 14.1% 4.2 808 159 16.5% 4.8 810 314 8.6% 7.8 399 41 28.2% 3.7 714 247 5.8% 2.8 999 105 13.3% 4.2 397 211 2.5% 22.2 679 112 13.3% 5.1 552 231 5.7% 15.1 74 139 13.3% 5.3 122 45 12.7% 8.5 730 144 9.6% 2.9 Three-Year Weighted Revenue Growth (10%) 52.5% 5.9% 33.6% 9.0% 11.4% 3.6% 7.8% 15.7% 14.0% 3.6% -0.6% 13.4% 4.9% 10.6% 11.5% 10.5% 6.7% 23.4% 6.9% 29.8% -0.6% 3.1% 13.5% 25.9% 3.3% Composite Score 9.51 5.87 5.86 5.04 4.97 4.91 4.67 4.35 4.33 4.27 4.05 3.85 3.79 3.62 3.41 3.41 3.22 2.91 2.87 2.75 2.51 2.51 2.48 2.37 2.35 Notes: 1. Gartner Opinion and Peer Opinion: Based on each panel's forced-rank ordering against the definition of "DDVN orchestrator" 2. ROA: ((2012 net income / 2012 total assets) * 50%) + ((2011 net income / 2011 total assets) * 30%) + ((2010 net income /2010 total assets) * 20%) 3. Inventory Turns: 2012 cost of goods sold / 2012 quarterly average inventory 4. Revenue Growth: ((change in revenue 2012-2011) * 50%) + ((change in revenue 2011-2010) * 30%) + ((change in revenue 2010-2009) 20%) 5. Composite Score: (Peer Opinion * 25%) + (Gartner Research Opinion * 25%) + (ROA * 25%) + (Inventory Turns * 15%) + (Revenue Growth * 10%) 6. 2012 data used where available. Where unavailable, latest available full-year data used. All raw data normalized to a 10- point scale prior to composite calculation. "Ranks for tied composite scores are determined using next decimal point comparison EXHIBIT 10: KEY COMPARATIVE INFORMATION FOR SAMSUNG, BLACKBERRY AND NOKIA Samsung In U.S. dollars Net sales Cost of sales Gross margin Research & development expense Net income (loss) Total shareholders' equity FY 2009 117,821 81,756 36,065 6,384 8,436 63,131 FY 2010 137,905 91,562 46,343 8,115 14,400 79,685 FY 2011 142,403 96,785 45,618 8,613 11,853 87,896 FY 2012 188,351 118,621 69,730 NA 22,333 113,777 FY 2013 217,462 130,934 86,528 NA 28,978 142,649 Accounts receivable, net Accounts payable Inventories Land & buildings Cash equivalents Total assets 15,400 7,117 8,504 37,648 19,336 96,954 17,081 957 11,919 47,236 22,759 119,764 18,885 884 13,564 53,546 25,979 134,315 22,348 1,092 16,622 64,142 39,972 169,589 23,761 1,002 18,195 71,789 57,751 203,562 BlackBerry In U.S. dollars Net sales Cost of sales Gross margin Research & development expense Net income (loss) Total shareholders' equity FY 2009 14,953 8,369 6,584 965 2,457 7,603 FY 2010 19,907 11,082 8,825 1,351 3,411 8,938 FY 2011 18,435 11,856 6,579 1,559 1,164 10,100 FY 2012 11,073 7,639 3,434 1,509 (646) 9,460 FY 2013 6,813 6,856 (43) 1,286 (5,873) 3,625 Accounts receivable, net Accounts payable Inventories Land & buildings Cash equivalents Total assets 2,594 616 622 1,957 1,911 10,204 3,955 832 618 2,504 2,121 12,875 3,062 744 1,027 2,748 1,774 13,731 2,353 1,064 603 2,395 2,654 13,165 972 474 244 942 2,529 7,552 Nokia In U.S. dollars Net sales Cost of sales Gross margin Research & development expense Net income (loss) Total shareholders' equity Accounts receivable, net Accounts payable Inventories Land & buildings Cash equivalents Total assets FY 2009 59040 39933 19107 8512 375 21247 FY 2010 56809 39655 17154 7847 1797 21723 FY 2011 50004 35363 14641 7259 -1925 18000 FY 2012 39773 28715 11058 6303 -4994 12452 FY 2013 17497 10138 7359 3606 -1017 9169 11497 7131 2687 2690 1645 51483 10131 8165 3377 2615 2611 52361 9288 7155 3014 2383 2531 46829 7316 5792 2027 1886 4618 39474 3994 2536 1107 779 5061 34681 EXHIBIT 11: APPLE'S HISTORICAL FINANCIAL INFORMATION (SELECTED) Net sales Cost of sales Gross margin Research & development expense Net income (loss) Total shareholders' equity FY 2013 FY 2012 FY 2011 FY 2010 FY 2009 FY 2008 FY 2007 FY 2006 FY 2005 9/28/2013 9/29/2012 9/24/2011 9/25/2010 9/26/2009 9/27/2008 9/29/2007 9/30/2006 9/24/2005 170,910,000 156,508,000 108,249,000 65,225,000 36,537,000 32,479,000 24,006,000 19,315,000 13.931,000 106,606,000 87,846,000 64,431,000 39,541,000 23,397,000 21,334,000 15,852,000 13,717,000 9.888,000 64,304,000 68,662.000 43,818,000 25,684,000 13,140,000 11,145,000 8,154,000 5,598,000 4,043,000 4,475,000 3,381,000 2.429,000 1,782,000 1,333,000 1,109,000 782,000 712,000 534,000 37,037,000 41,733,000 25,922,000 14,013,000 5,704,000 4,834,000 3,496,000 1,989,000 1,335,000 123,549,000 118,210,000 76,615,000 47,791,000 27,832,000 21.030,000 14,532,000 9,984,000 7,466,000 Accounts receivable, net Accounts payable Inventories Land & buildings Cash equivalents Total assets 13,102,000 10,930,000! 5,369,000 5,510,000 3,361,000 2.422.000 1,637,0001 1,252,000 895,000 22,367,000 21,175,000 14,632,000 12,015,000 5,601,000 5,520,000 4,970,000 3,390,000 1,779,000 1,764,000 791,000 776,000 1,051,000 455,000 509,000 346,000 270,000 165,000 3,309,000 2,439,000 2,059,000 1,471,000 955,000 810,000 762,000 626,000 361,000 146,761,000 121,251,000 81,570,000 51,011,000 33,992,000 24,490,000 15,386,000 10,110,000 8,261,000 207,000,000 176,064,000 116,371.000 75.183.000 53.851,000 39,572,000 25,347,000 17,205,000 11,551,000 Full-time employees 80,300 72,800 60,400 46,600 34,300 32,000 21,600 17,787 14,800 Net sales Cost of sales Gross margin Research & development expense Net income (loss) Total shareholders' equity FY 2004 FY 2003 FY 2002 FY 2001 FY 2000 FY 1999 FY 1998 FY 1997 FY 1996 9/25/2004 9/27/2003 9/28/2002 9/29/2001 9/30/2000 9/25/1999 9/25/1998 9/26/1997 9/27/1996 8,279,000 6,207,000 5,742,000 5,363,000 7,983,000 6,134,000 5,941,000 7,081,000 9,833,000 6,020,000 4,499,000 4,139,000 4,128,000 5,817,000 4,438,000 4,462,000 5,713,000 8,865,000 2,259,000 1,708,000 1,603,000 1,235,000 2,166,000 1,696,000 1,479,000 1,368,000 968,000 489,000 471,000 446,000 430,000 380,000 314,000 303,000 485.000 604,000 276,000 69,000 65,000 -25,000 786,000 601,000 309,000 -1,045,000 -816,000 5,076,000 4,223,000 4,095,000 3,920,000 4,107,000 3,104,000 1,642,000 1,200,000 2,058,000 Accounts receivable, net Accounts payable Inventories Land & buildings Cash equivalents Total assets 774,000 766,000 565,000 466,000 953,000 681,000 955,000 1,035,000 1,496,000 1,451,000 1,154,000 911,000 801,000 1,157,000 812,000 719,000 685,000 791,000 101,000 56,000 45,000 11,000 33,000 20.000 78,000 437,000 662,000 351,000 350,000 342.000 337,000 324,000 323,000 338,000 453,000 480,000 5,464,000 4,566,000 4,337,000 4,336,000 4,027,000 3,226,000 2,300,000 1,459,000 1,745,000 8,050,000 6,815,000 6,298,000 6,021,000 6.803,000 5,161,000 4,289,000 4,233,000 5,364,000 Full-time employees 11,695 10,912 10,211 9,603 8,568 6,960 6,658 8,437 NA EXHIBIT 12: APPLE'S SEGMENT INFORMATION 2013 Change 2012 Change 2011 Net Sales by Operating Segment: Americas Europe Greater China (a) Japan Rest of Asia Pacific Retail Total net sales $62,739 37,883 25,417 13,462 11,181 20,228 $170,910 9% 4% 13% 27% 4% 7% 9% $57,512 36,323 22,533 10,571 10,741 18,828 $156,508 50% 31% 78% 94% 8% 33% 45% $38,315 27,778 12,690 5,437 9,902 14,127 $108,249 Net Sales by Product: iPhone (b) iPad (b) Mac (b) iPod (b) iTunes, software and services (c) Accessories (d) Total net sales $91,279 31,980 21,483 4,411 16,051 5,706 $170,910 16% 3% -7% -21% 25% 11% 9% $78,692 30,945 23,221 5,615 12,890 5,145 $156,508 71% 61% 7% -25% 38% 15% 45% $45,998 19,168 21,783 7,453 9,373 4,474 $108,249 Unit Sales by Product: iPhone iPad Mac iPod 150,257 71,033 16,341 26,379 20% 22% -10% -25% 125,046 58,310 18,158 35,165 73% 80% 9% -17% 72.293 32,394 16,735 42,620
Step by Step Solution
There are 3 Steps involved in it
Step: 1

Get Instant Access to Expert-Tailored Solutions
See step-by-step solutions with expert insights and AI powered tools for academic success
Step: 2

Step: 3
Ace Your Homework with AI
Get the answers you need in no time with our AI-driven, step-by-step assistance
Get Started
Financial Markets And Institutions
Authors: Jeff Madura
8th Edition
0324568215, 978-0324568219