

Answered step by step
Verified Expert Solution
Question
1 Approved Answer
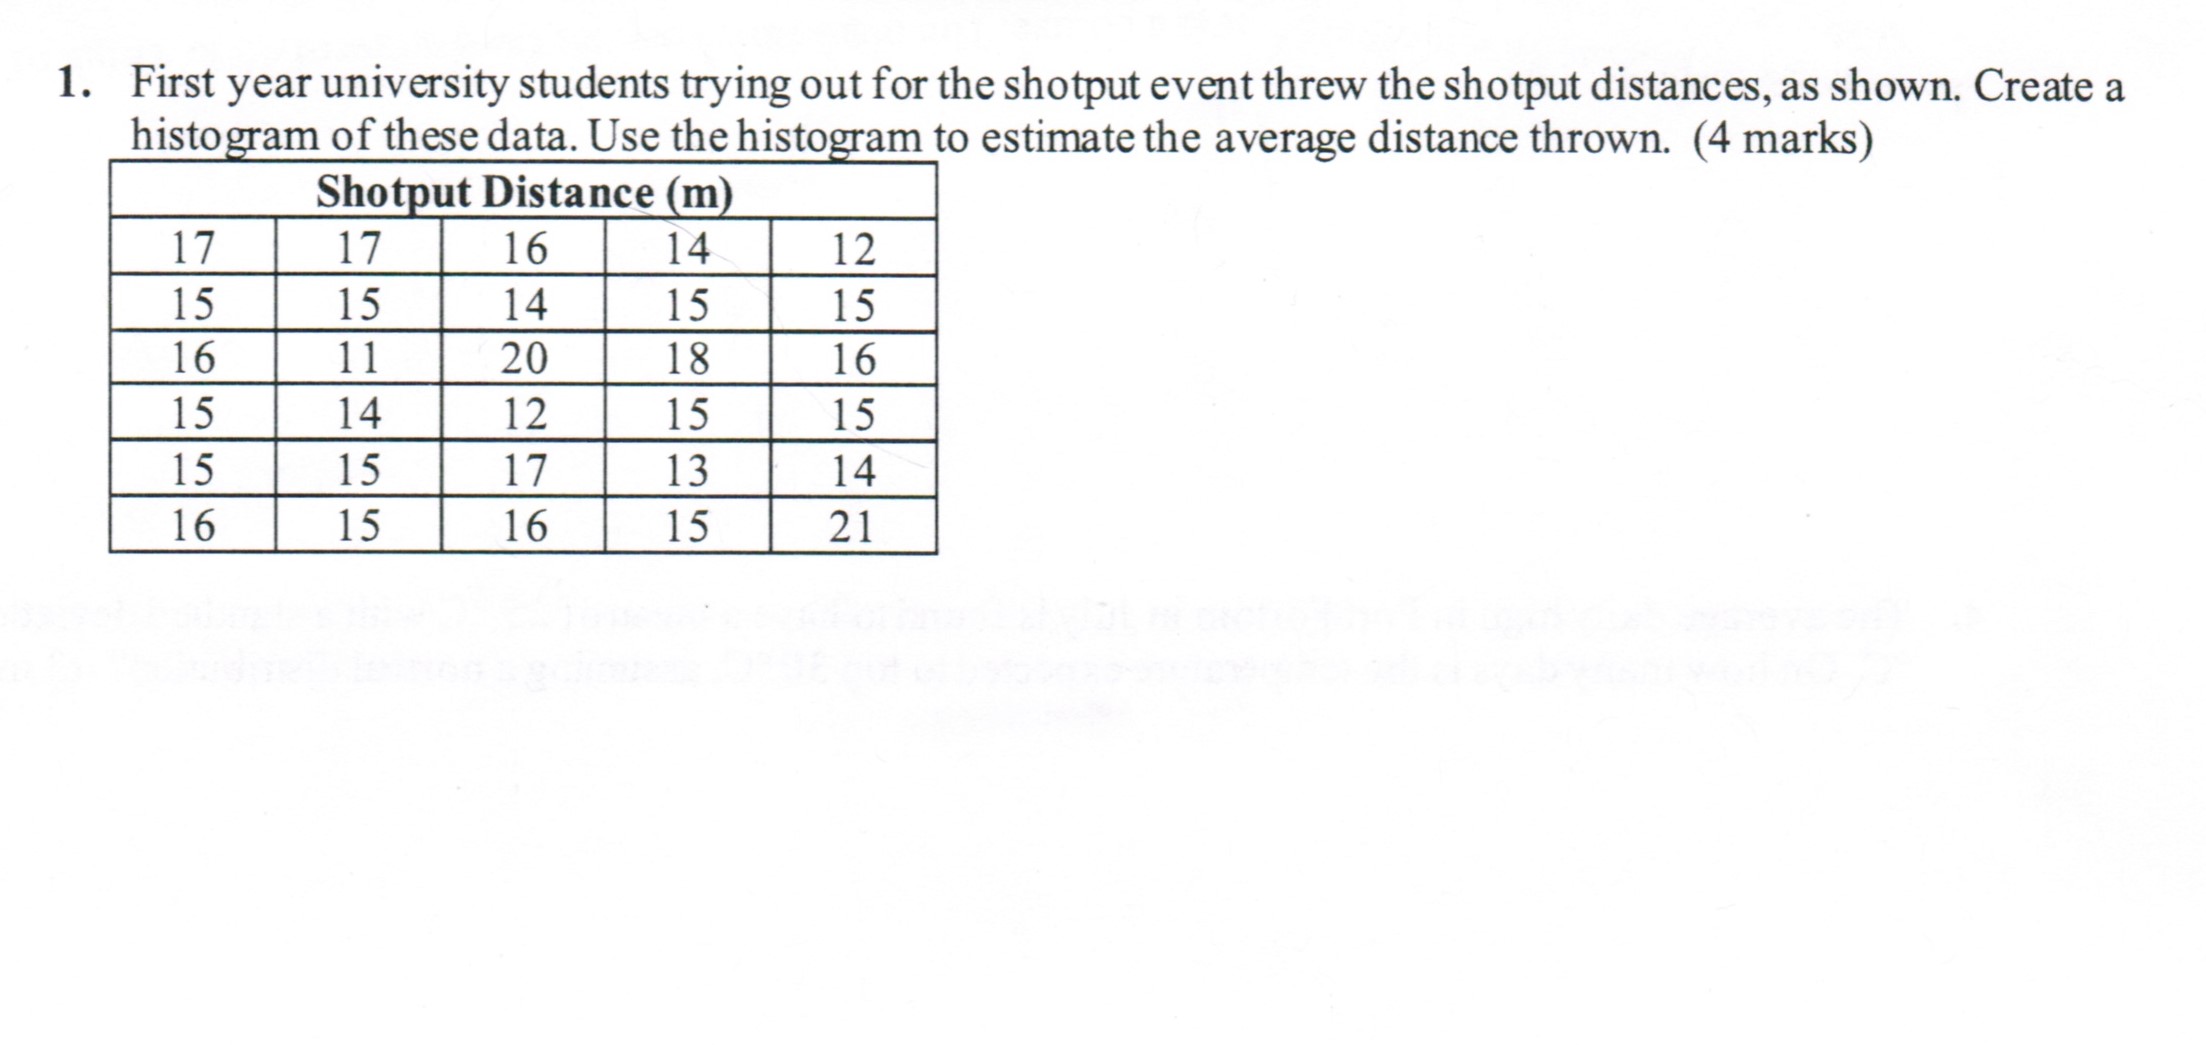
1. First year university students trying out for the shotput event threw the shotput distances, as shown. Create a histogram of these data. Use the
Step by Step Solution
There are 3 Steps involved in it
Step: 1

Get Instant Access to Expert-Tailored Solutions
See step-by-step solutions with expert insights and AI powered tools for academic success
Step: 2

Step: 3
Ace Your Homework with AI
Get the answers you need in no time with our AI-driven, step-by-step assistance
Get Started
Discrete Mathematics, Edition
Authors: Seymour Lipschutz, Marc Lipson
4th Edition
126425881X, 9781264258819