

Answered step by step
Verified Expert Solution
Question
1 Approved Answer
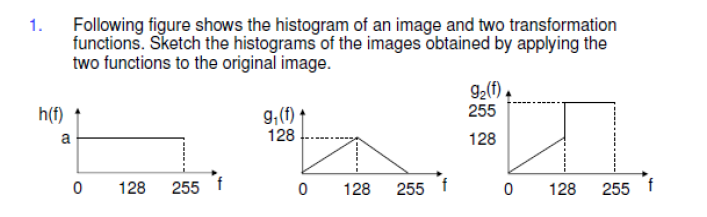
1. Following figure shows the histogram of an image and two transformation functions. Sketch the histograms of the images obtained by applying the two functions
Step by Step Solution
There are 3 Steps involved in it
Step: 1

Get Instant Access to Expert-Tailored Solutions
See step-by-step solutions with expert insights and AI powered tools for academic success
Step: 2

Step: 3
Ace Your Homework with AI
Get the answers you need in no time with our AI-driven, step-by-step assistance
Get Started
Oracle Autonomous Database In Enterprise Architecture
Authors: Bal Mukund Sharma, Krishnakumar KM, Rashmi Panda
1st Edition
1801072248, 978-1801072243