Answered step by step
Verified Expert Solution
Link Copied!

Question

1 Approved Answer

1. For the cash flow diagram shown in the figure below, A1 = $65,000 $6000 i= 6.5% A10 = $2000 0 3 5 6 7
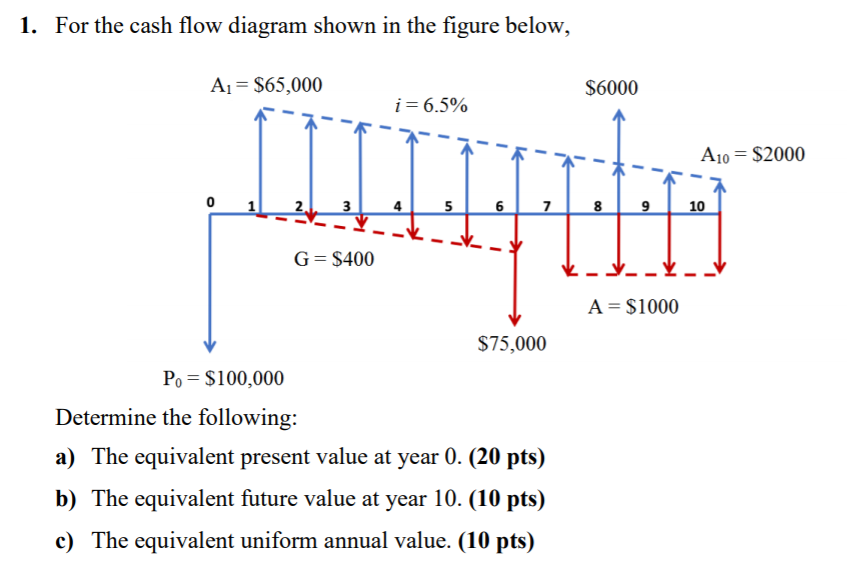
image text in transcribed

1. For the cash flow diagram shown in the figure below, A1 = $65,000 $6000 i= 6.5% A10 = $2000 0 3 5 6 7 8 9 10 G= $400 A= $1000 $75,000 Po = $100,000 Determine the following: a) The equivalent present value at year 0. (20 pts) b) The equivalent future value at year 10. (10 pts) c) The equivalent uniform annual value. (10 pts) 1. For the cash flow diagram shown in the figure below, A1 = $65,000 $6000 i= 6.5% A10 = $2000 0 3 5 6 7 8 9 10 G= $400 A= $1000 $75,000 Po = $100,000 Determine the following: a) The equivalent present value at year 0. (20 pts) b) The equivalent future value at year 10. (10 pts) c) The equivalent uniform annual value. (10 pts)

Step by Step Solution

There are 3 Steps involved in it

Step: 1

blur-text-image

Get Instant Access to Expert-Tailored Solutions

See step-by-step solutions with expert insights and AI powered tools for academic success

Step: 2

blur-text-image

Step: 3

blur-text-image

Ace Your Homework with AI

Get the answers you need in no time with our AI-driven, step-by-step assistance

Get Started

Recommended Textbook for

Finance For Beginners

Authors: Shlomo Simanovsky

1st Edition

1936703009

More Books

Students also viewed these Finance questions

Question

explain the functions of management,

Answered: 1 week ago