Question
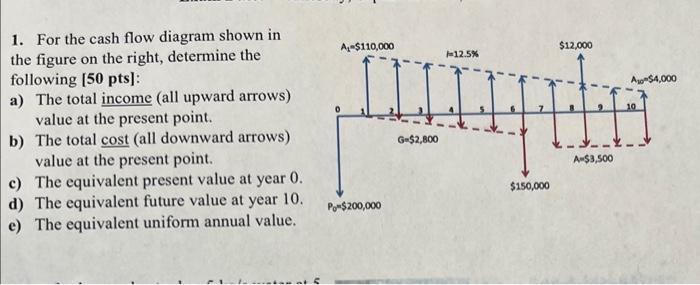
1. For the cash flow diagram shown in the figure on the right, determine the following [50 pts]: a) The total income (all upward

1. For the cash flow diagram shown in the figure on the right, determine the following [50 pts]: a) The total income (all upward arrows) value at the present point. b) The total cost (all downward arrows) value at the present point. c) The equivalent present value at year 0. d) The equivalent future value at year 10. e) The equivalent uniform annual value. A $110,000 12.5% IIIIH G-$2,800 Po $200,000 $150,000 $12,000 $4,000 11 A-$3,500
Step by Step Solution
3.39 Rating (158 Votes )
There are 3 Steps involved in it
Step: 1

Get Instant Access to Expert-Tailored Solutions
See step-by-step solutions with expert insights and AI powered tools for academic success
Step: 2

Step: 3

Ace Your Homework with AI
Get the answers you need in no time with our AI-driven, step-by-step assistance
Get StartedRecommended Textbook for
Engineering Economy
Authors: Leland T. Blank, Anthony Tarquin
8th edition
73523439, 73523437, 978-0073523439
Students also viewed these Accounting questions
Question
Answered: 1 week ago
Question
Answered: 1 week ago
Question
Answered: 1 week ago
Question
Answered: 1 week ago
Question
Answered: 1 week ago
Question
Answered: 1 week ago
Question
Answered: 1 week ago
Question
Answered: 1 week ago
Question
Answered: 1 week ago
Question
Answered: 1 week ago
Question
Answered: 1 week ago
Question
Answered: 1 week ago
Question
Answered: 1 week ago
Question
Answered: 1 week ago
Question
Answered: 1 week ago
Question
Answered: 1 week ago
Question
Answered: 1 week ago
Question
Answered: 1 week ago
Question
Answered: 1 week ago
Question
Answered: 1 week ago
Question
Answered: 1 week ago
Question
Answered: 1 week ago
View Answer in SolutionInn App


