

Answered step by step
Verified Expert Solution
Question
1 Approved Answer
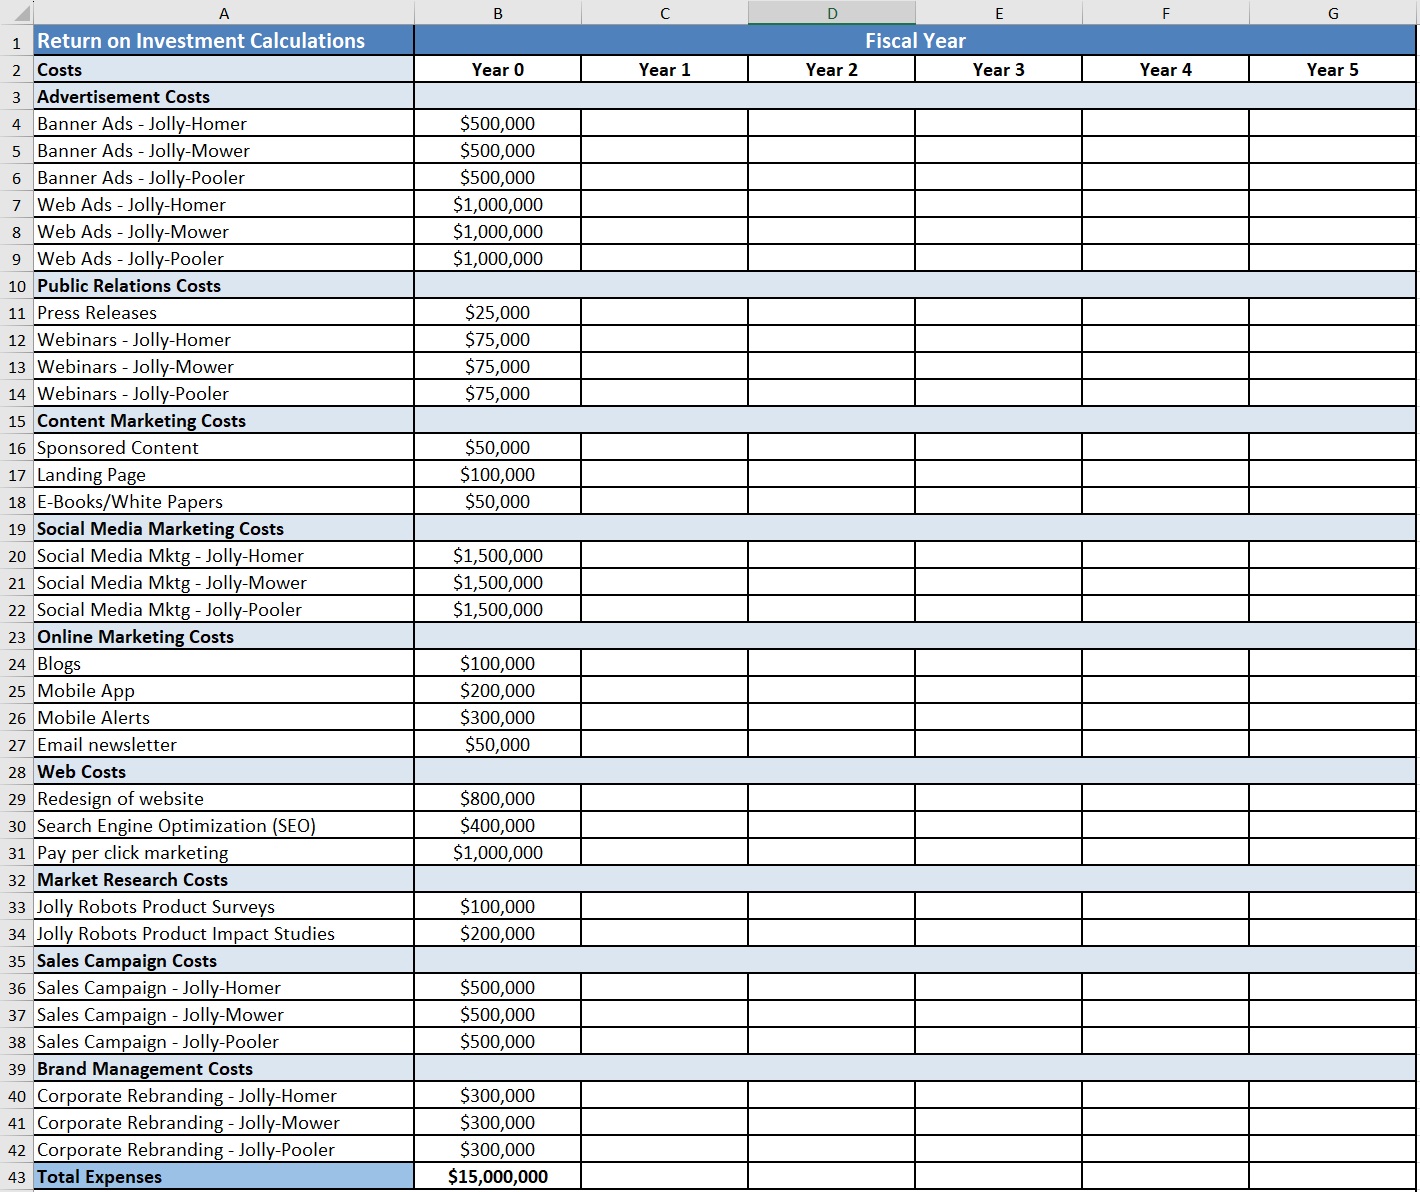
1 . For years 2 through 5 , the product research team at Jolly Motors conducted some research. They arrived at the following profit contribution
For years through the product research team at Jolly Motors conducted some research. They arrived at the following profit contribution growth projections shown in the table below:
Product Annual Growth Rate
JollyHomer
JollyMower
JollyPooler
Unspecified
In arriving at the yearly growth rates shown above, the product research team concluded that JollyHomer is the product with the higher anticipated growth since most homes need this product. Though JollyMower is popular, different houses have different lawn sizes, hence, several houses may not use the mower. Similarly, not all houses have pools. This reasoning accounted for the differences in growth rates. When the increase is not tied to a specific product, the team estimated the annual growth to be see the entry "Unspecified" in the above table Use the above table for yearly growth in incremental profit contributions for years thru For example, in the category "Incremental Profit Contributions from Social Media Marketing", JollyHomer's yearly growth rate for years through will be while JollyMower's incremental profit contributions yearbyyear growth should be Similarly, all the items in "Incremental Profit Contributions from Web" and "Incremental Profit Contributions from Market Research Costs" should use a yearly growth rate of for years through since these increases are not tied to a specific product
Arrive at net cash flows for years thru Use the information given in step above for incremental profit contributions for years thru
Compute the following: Payback Period; Internal Rate of Return IRR; ROI; and Profitability Index.
For the discount rate of compute NPV using two different methods: Using the Excel formula, and Using individual period discount factors: Arrive at discount factors for each year for years through ; Multiply the net cash flow for the year with the discount factor; and add the resulting values for years through to arrive at NPV
Step by Step Solution
There are 3 Steps involved in it
Step: 1

Get Instant Access to Expert-Tailored Solutions
See step-by-step solutions with expert insights and AI powered tools for academic success
Step: 2

Step: 3
Ace Your Homework with AI
Get the answers you need in no time with our AI-driven, step-by-step assistance
Get Started
The Economics Of Money Banking And Financial Markets
Authors: Frederic S. Mishkin
7th Edition
0321122356, 978-0321122353