

Question
1) From the following market data: Calculate the Beta of each stock. Stock 1 Beta = a)1.15 b)2.15 c)0.15 Stock 2 Beta = a)0.85 b)0.52
1) From the following market data:
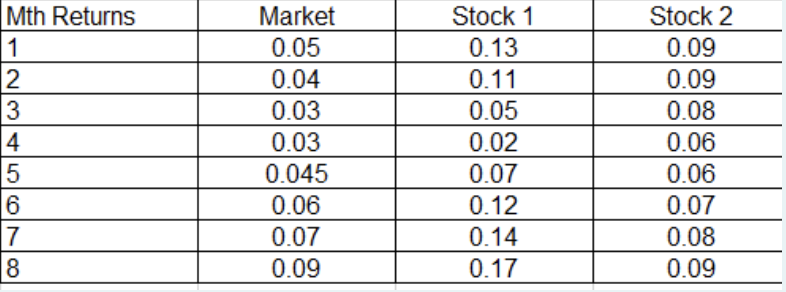
Calculate the Beta of each stock.
Stock 1 Beta =
a)1.15
b)2.15
c)0.15
Stock 2 Beta =
a)0.85
b)0.52
c)0.25
Which stock is more sensative to market risk?
a)stock 1
b)stock 2
2)The Rf = 2% and the return of the ASX200 = 10%. The ASX200 is a share index that can be used to proxy the return of the market.
The E(R) of stock 1 is
a)17.17%
b)21.17%
c)19.17%
The E(R) of stock 2 is
a)3.97%
b)2.97%
c)1.97%
3)A market analyst estimates that the E(r) for Stock 1 as 21% and Stock 1 as 1%.
Comparing these to the appropriate CAPM E(r), the market analyst return estimates will lead to......of Stock 1
a)under-pricing
b)over-pricing
Comparing these to the appropriate CAPM E(r), the market analyst return estimates will lead to......of Stock 2
a)under-pricing
b)over-pricing
This is because the E(r) is used as the discount rate to value the cash flows of the stock and using a discount rate that is too.........will result in underpricing
a)low
b)high
This is because the E(r) is used as the discount rate to value the cash flows of the stock and using a discount rate that is too.........will lead to overpricing.
a)low
b)high
\begin{tabular}{l|c|c|c} \hline Mth Returns & Market & Stock 1 & Stock 2 \\ \hline 1 & 0.05 & 0.13 & 0.09 \\ \hline 2 & 0.04 & 0.11 & 0.09 \\ \hline 3 & 0.03 & 0.05 & 0.08 \\ \hline 4 & 0.03 & 0.02 & 0.06 \\ \hline 5 & 0.045 & 0.07 & 0.06 \\ \hline 6 & 0.06 & 0.12 & 0.07 \\ \hline 7 & 0.07 & 0.14 & 0.08 \\ \hline 8 & 0.09 & 0.17 & 0.09 \\ \hline \end{tabular}
Step by Step Solution
There are 3 Steps involved in it
Step: 1

Get Instant Access to Expert-Tailored Solutions
See step-by-step solutions with expert insights and AI powered tools for academic success
Step: 2

Step: 3
Ace Your Homework with AI
Get the answers you need in no time with our AI-driven, step-by-step assistance
Get Started
Connect Online Access For Foundations Of Financial Management
Authors: BLOCK
18th Edition
1266037829