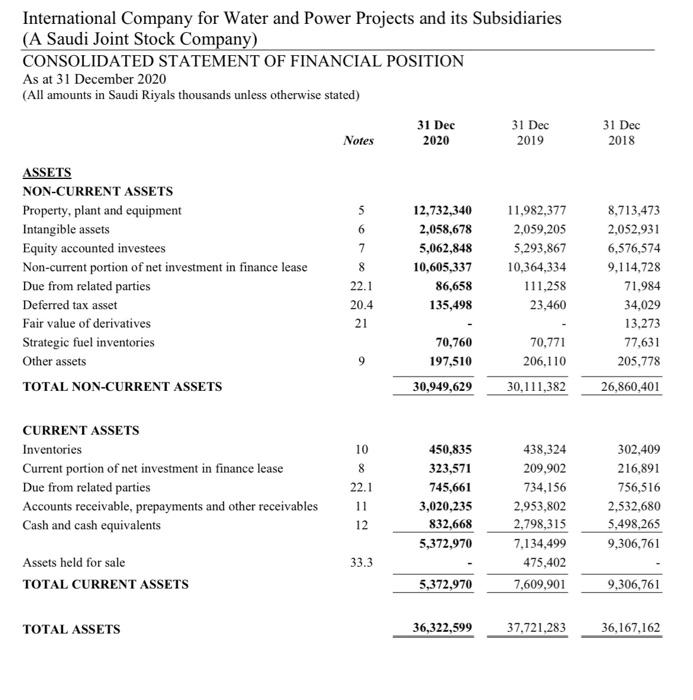
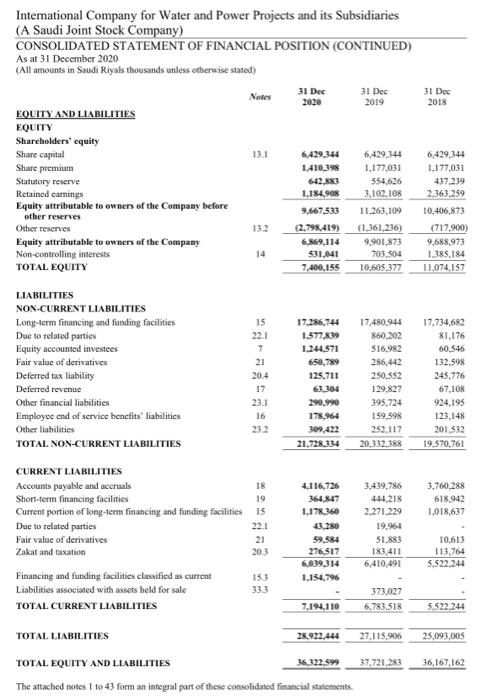
1. From the latest financial statement of the company
calculate Earnings per share,
Dividend cover ratio and
Price earning ratio of the company.
2. Evaluate the performance of the company based on the above ratios.

31 Dec 2018 International Company for Water and Power Projects and its Subsidiaries (A Saudi Joint Stock Company) CONSOLIDATED STATEMENT OF FINANCIAL POSITION As at 31 December 2020 (All amounts in Saudi Riyals thousands unless otherwise stated) 31 Dec 31 Dec Notes 2020 2019 ASSETS NON-CURRENT ASSETS Property, plant and equipment 12,732,340 11,982,377 Intangible assets 2,058,678 2,059,205 Equity accounted investees 5,062,848 5,293,867 Non-current portion of net investment in finance lease 10,605,337 10,364,334 Due from related parties 22.1 86,658 111,258 Deferred tax asset 20.4 135,498 23,460 Fair value of derivatives 21 Strategic fuel inventories 70,760 70,771 Other assets 197,510 206,110 TOTAL NON-CURRENT ASSETS 30,949,629 30,111,382 5 6 7 8 8,713,473 2,052,931 6,576,574 9,114,728 71,984 34,029 13.273 77,631 205,778 26,860,401 9 10 CURRENT ASSETS Inventories Current portion of net investment in finance lease Due from related parties Accounts receivable, prepayments and other receivables Cash and cash equivalents 8 22.1 11 12 450,835 323,571 745,661 3,020,235 832,668 5,372,970 438,324 209,902 734,156 2,953,802 2,798,315 7.134,499 475,402 7,609,901 302,409 216,891 756,516 2,532,680 5,498,265 9,306,761 33.3 Assets held for sale TOTAL CURRENT ASSETS 5,372,970 9,306,761 TOTAL ASSETS 36,322,599 37,721,283 36,167,162 International Company for Water and Power Projects and its subsidiaries (A Saudi Joint Stock Company) CONSOLIDATED STATEMENT OF FINANCIAL POSITION (CONTINUED) As at 31 December 2020 (All amounts in Saudi Riyals thousands unless otherwise stated) Notes 31 Dec 2020 31 Dec 2019 31 Dec 2018 13.1 EQUITY AND LIABILITIES EQUITY Shareholders' equity Share capital Share premium Statutory reserve Retained carings Equity attributable to owners of the Company before other reserves Other reserves Equity attributable to owners of the Company Non-controlling interests TOTAL EQUITY 6,429,344 1.410,398 642.883 1.184.968 6,429,344 1.177,031 437.239 2,363.259 6,429,344 1,177,031 554.626 3.102.108 11.263,109 (1,361,236) 9.901,873 703.504 10.605,377 9.667,533 (2.798,419) 6,869,114 531,041 7.400.155 132 10,406,873 (717.900) 9,688,973 1.385,184 11,074,157 14 LIABILITIES NON-CURRENT LIABILITIES Long-term financing and funding facilities Due to related parties Equity accounted investees Fair value of derivatives Deferred tax liability Deferred revenue Other financial liabilities Employee end of service benefits' liabilities Other liabilities TOTAL NON-CURRENT LIABILITIES 15 22.1 7 21 20.4 17 23.1 16 23.2 17.286.744 1.577.839 1.244.571 650,789 125.711 63.104 290,990 178,964 309.422 21,728,334 17.480,944 860,202 516,982 286,442 250,352 129,827 395,724 159.598 252.117 20.332,388 17.734,682 81,176 60.546 132.598 245,776 67,108 924.195 123.148 201,532 19,570,761 19 3,760,288 618.942 1,018,637 CURRENT LIABILITIES Accounts payable and accruals 18 Short-term financing facilities Current portion of long-term financing and funding facilities 15 Due to related parties 22.1 Fair value of derivatives 21 Zakat and taxation 203 Financing and funding facilities classified as current Liabilities associated with assets held for sale TOTAL CURRENT LIABILITIES 4,116,725 364.847 1.178.360 43.280 59,584 276,517 6,639,314 1,134,796 3,439,786 444,218 2,271,229 19.961 51.883 183,411 6,410,491 10,613 113,764 5.522.244 153 333 373,027 6,783,518 7.194.110 5.522.244 28.922.444 27.115,906 25.093,005 TOTAL LIABILITIES TOTAL EQUITY AND LIABILITIES 36 322.399 The attached notes 1 to 43 form an integral part of these consolidated financial statements. 37,721,283 36,167,162


