Answered step by step
Verified Expert Solution
Question
1 Approved Answer
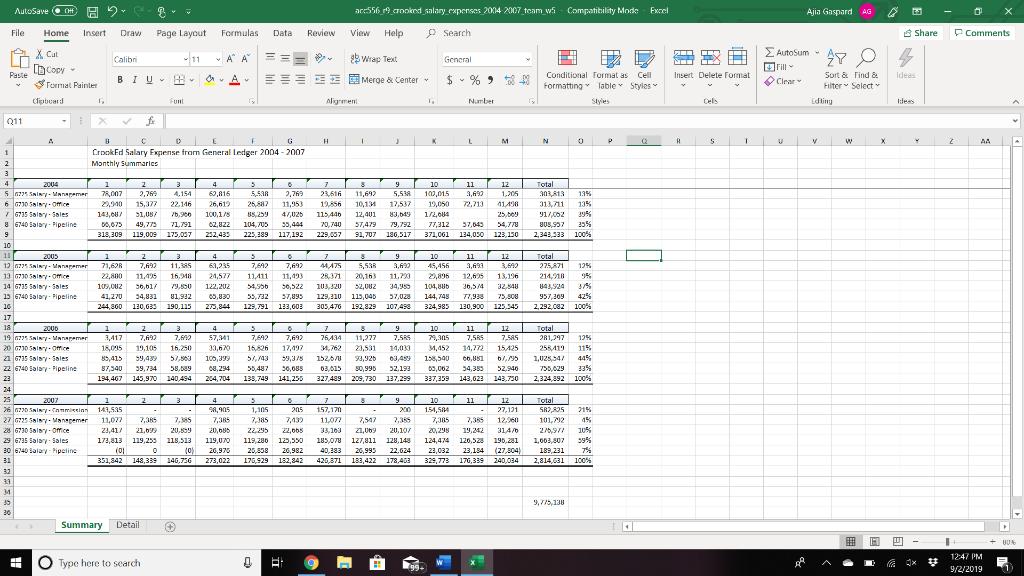
The attached spreadsheet (CrookEd Salary Expenses 2011-2014) contains the data you discovered. The first tab is a Summary of data from 2004 2007. Payroll
The attached spreadsheet (“CrookEd Salary Expenses 2011-2014”) contains the data you discovered. The first tab is a Summary of data from 2004 – 2007. Payroll is broken into four categories: Management; Office; Sales; Pipeline.
The second tab is titled Detail. It is unclear to you if the Summary Data equates to the Detail. Likewise, at first glance, there are some questions you have related to the Summary data. Consequently, you and your team must to do the following:
Part 1:
- Scan the Summary data, make some observations and perform any relevant analysis on the data. For this portion of the assignment consider Fraud Examination, 5th Edition Chapters 6 “Data-Driven Fraud Detection”
- From the Detail tab data, create a Pivot Table and manipulate the data to determine if this data is the same as the data in the Summary tab. Create any additional inferences and make any other observations. For this portion of the assignment consider Fraud Examination, 5th Edition Chapters 6 “Data-Driven Fraud Detection”
Part 2:
- From your work in 1 and 2 above, create a set of questions you would like to ask the CFO of CrookEd (your instructor) specifically pertaining to the payroll data you have reviewed. For this portion of the assignment consider Fraud Examination, 5th Edition Chapters 10 “Inquiry Methods and Fraud Reports.”
- Based on your data analysis and interview write a two page memo describing your techniques, observations and conclusions. Include any questions you still have and information you would still like to obtain.
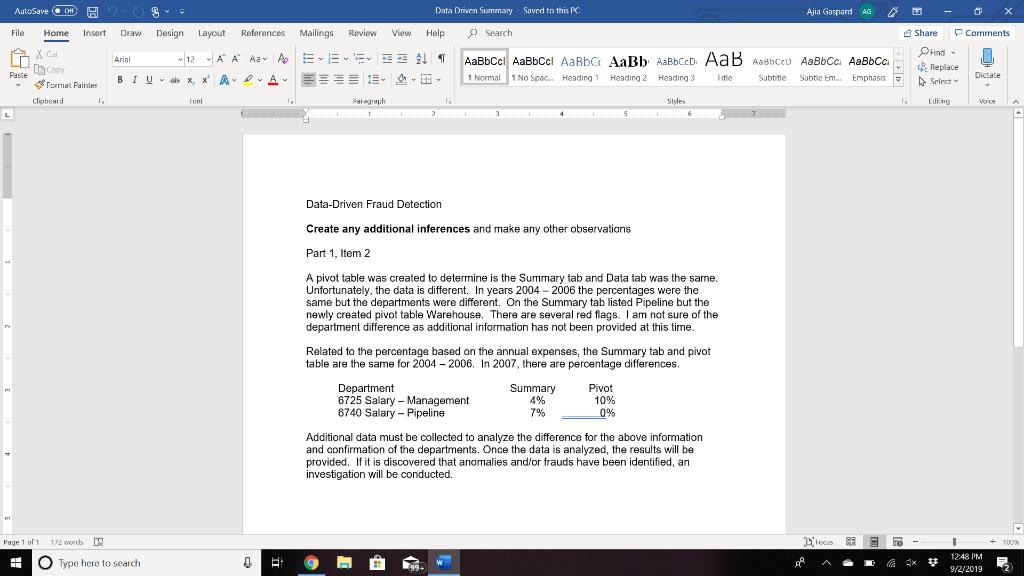
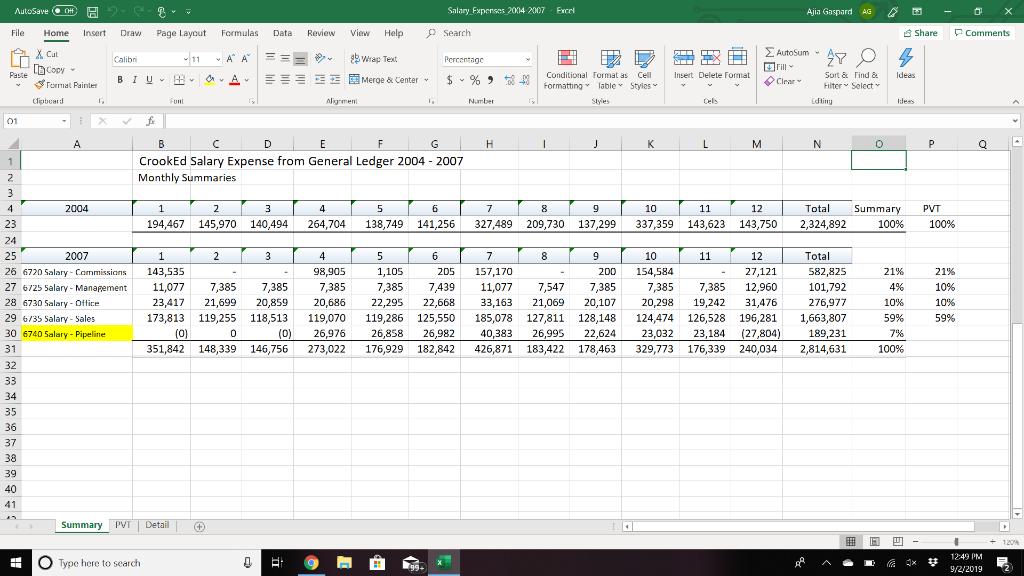
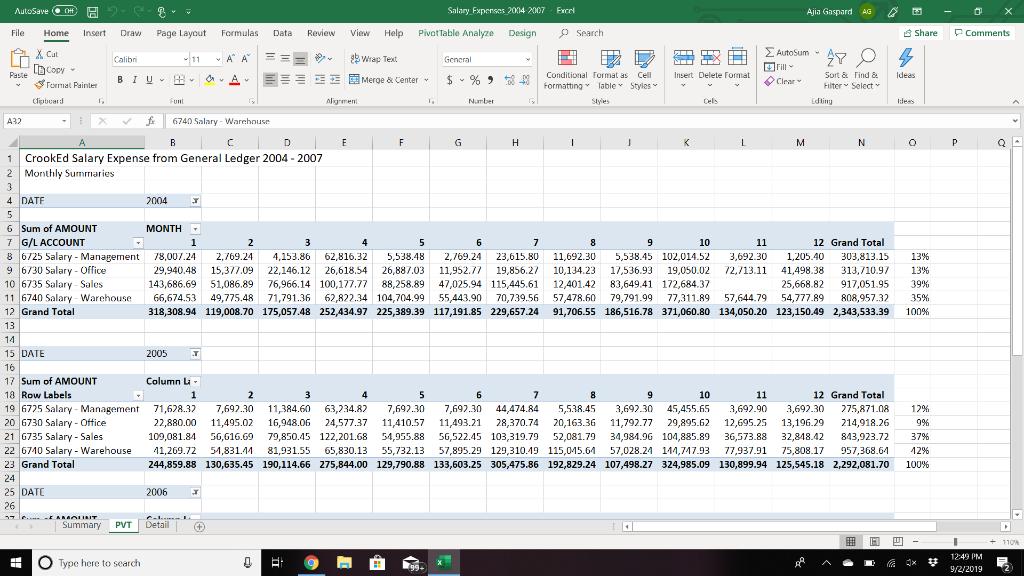
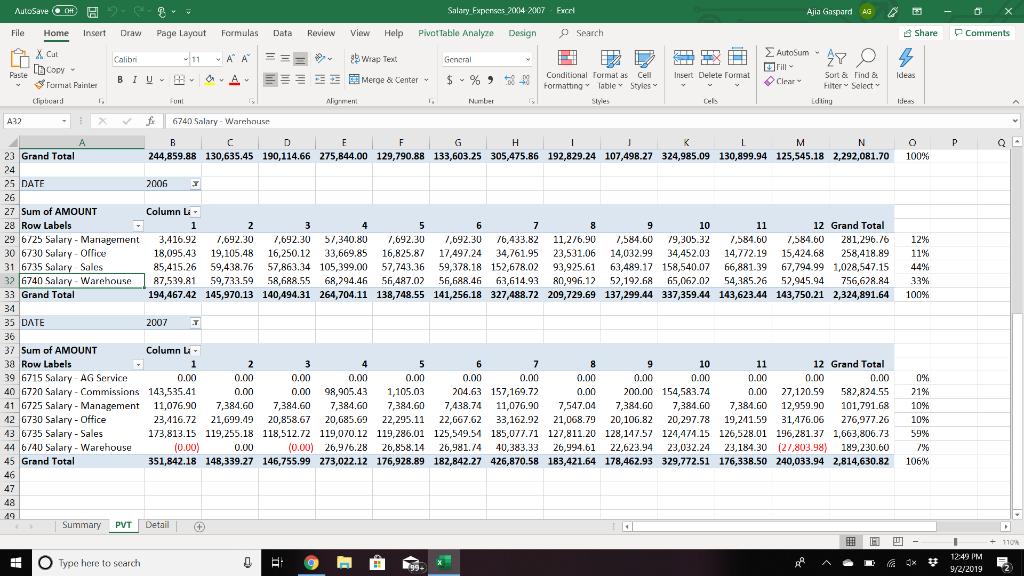
AutoSave O OH A 2-0 Data Driven Summary Saved to this PC Ajia Gaspard AG File Design References Mailings Review View Help P Search 8 Share P Comments Home Insert Draw Layout X Cal 12 A A Aav AE-E AaBbCcl AaBbCcl AaBbC AaBb AaBbCcD. AaB Aabbcco AaBbCc AaBbCc. Orind - Arial & Replace Dcopy Paste BIU- ab x, x A , 1 Normal 1 No Spac. Heading 1 Heading 2 Heading 3 Subtie Em. Emphasis Dictate Iitle Subtitle A Select Tormat Painter Cipbcard Tunt Palagraph Styles Edi. ng Voice 1 2 a I 4 S 6 Data-Driven Fraud Detection Create any additional inferences and make any other observations Part 1, Item 2 A pivot table was created to determine is the Summary tab and Data tab was the same. Unfortunately, the data is different. In years 2004 - 2006 the percentages were the same but the departments were different. On the Summary tab listed Pipeline but the newly created pivot table Warehouse. There are several red flags. I am not sure of the department difference as additional information has not been provided at this time. Related to the percentage based on the annual expenses, the Summary tab and pivot table are the same for 2004 -2006. In 2007, there are percentage differences. Department 6725 Salary Management 6740 Salary - Pipeline Summary 4% 7% Pivot 10% 0% Additional data must be collected to analyze the difference for the above information and confirmation of the departments. Once the data is analyzed, the results will be If it is discovered that anomalies and/or frauds have been identified, an investigation will be conducted. Page 1 of 1 172 words E Diecus BE 100% 12:48 PM O Type here to search %23 9/2/2019
Step by Step Solution
★★★★★
3.36 Rating (149 Votes )
There are 3 Steps involved in it
Step: 1
1What does one mean by an employee For example does one want only active employees soliciting for EMPLOYMENTSTATUS from the COMPPERSON EMPLOYEE or EMPLOYEEGENERAL tables adequate A only returns record...
Get Instant Access to Expert-Tailored Solutions
See step-by-step solutions with expert insights and AI powered tools for academic success
Step: 2

Step: 3

Ace Your Homework with AI
Get the answers you need in no time with our AI-driven, step-by-step assistance
Get Started


