

Answered step by step
Verified Expert Solution
Question
1 Approved Answer
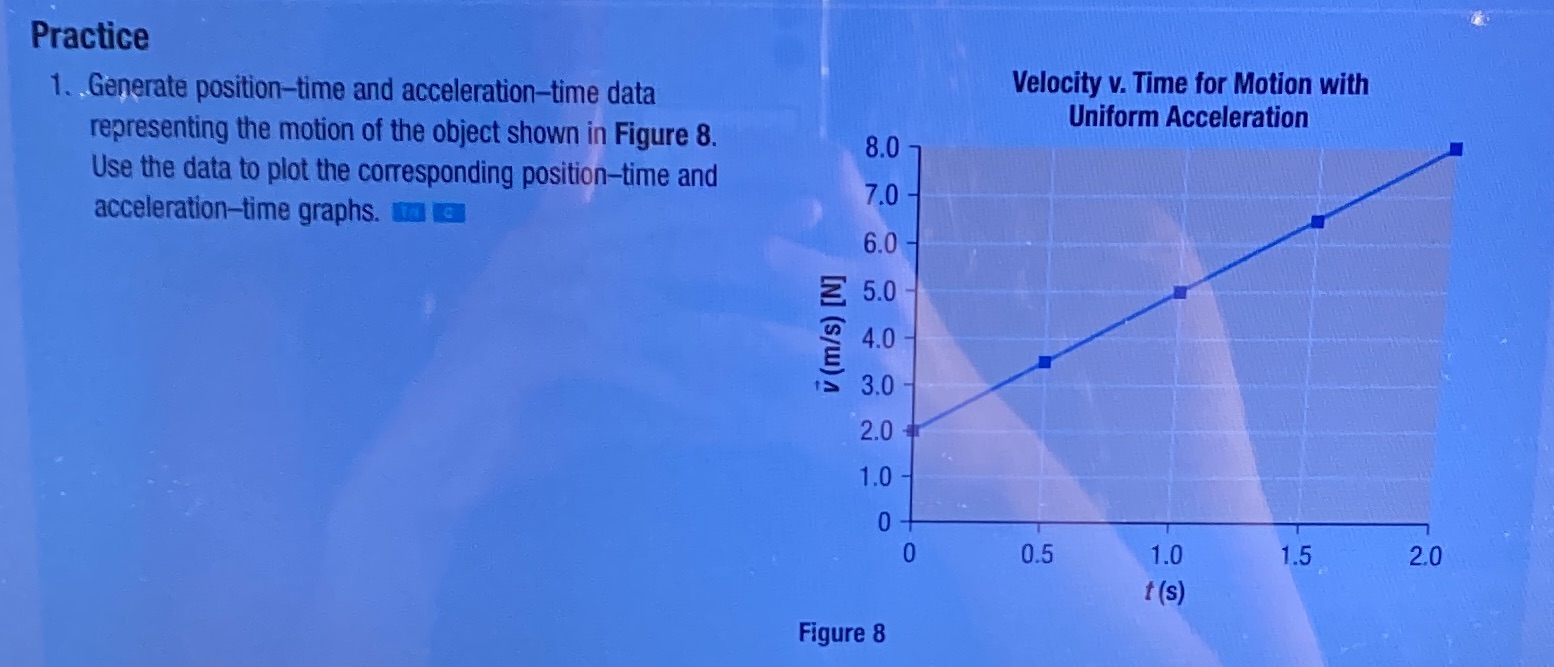
1. generate position- time and acceleration time- data representing the motion of the object showing in figure 8. use the data to plot the corresponding
1. generate position- time and acceleration time- data representing the motion of the object showing in figure 8. use the data to plot the corresponding position- time and acceleration -time graphs.
Step by Step Solution
There are 3 Steps involved in it
Step: 1

Get Instant Access to Expert-Tailored Solutions
See step-by-step solutions with expert insights and AI powered tools for academic success
Step: 2

Step: 3
Ace Your Homework with AI
Get the answers you need in no time with our AI-driven, step-by-step assistance
Get Started
Optical Properties Of Materials And Their Applications
Authors: Jai Singh, Peter Capper
2nd Edition
1119506050, 9781119506058