Question
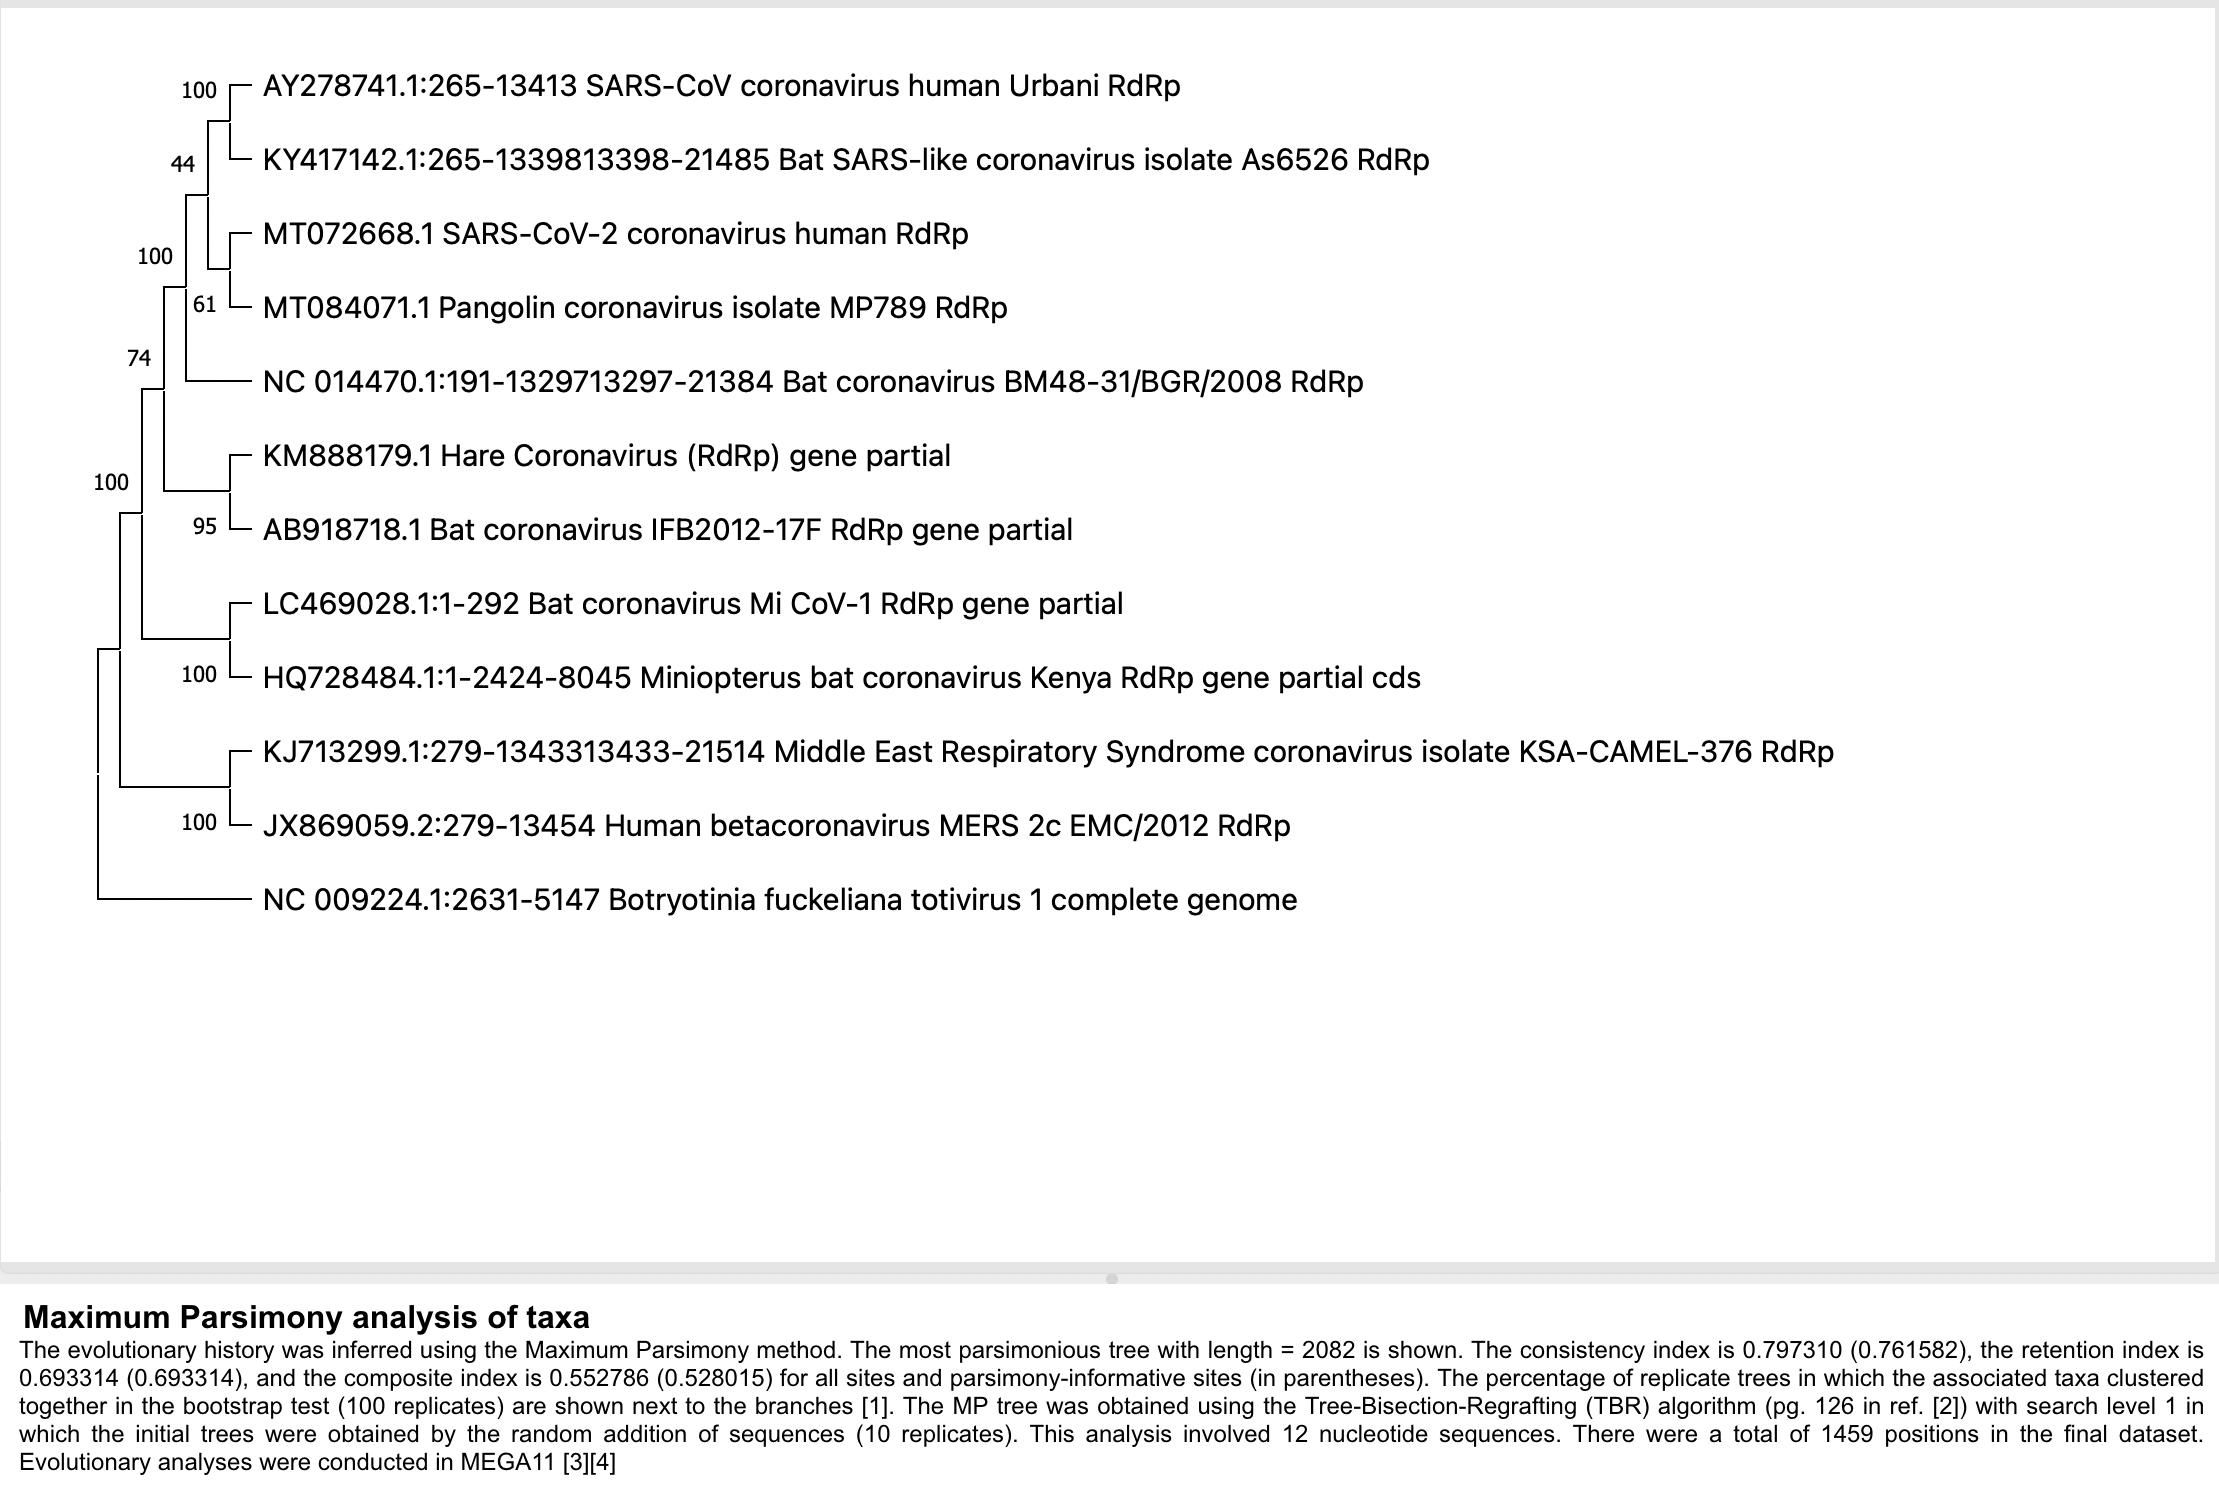
1. How did you ML and MP trees compare to each other in terms of relationships of coronaviruses? What about in terms of support from
1. How did you ML and MP trees compare to each other in terms of relationships of coronaviruses? What about in terms of support from bootstrapping (both used bootstrapping method)?
2. Which method (ML OR MP) seems more useful to you and why? Can you imagine a reason to use the method you think is less useful?
3. Based on the support: how confident are you that the use of RdRP is useful in comparing strains of viruses in the Coronaviridae?
4. from both trees discuss relationship between SARS-CoV, SARS-CoV-2, SARS-like coronavirus from pangolin and Bat SARS-like coronavirus?
5. Based on this tree, and only this tree, would you expect MERS or SARS-CoV to be more similar to SARS-CoV-2 and why ?


21 39 92 28 80 100 AY278741.1:265-13413 SARS-CoV coronavirus human Urbani RdRp - KY417142.1:265-1339813398-21485 Bat SARS-like coronavirus isolate As6526 RdRp NC 014470.1:191-1329713297-21384 Bat coronavirus BM48-31/BGR/2008 RdRp KJ713299.1:279-1343313433-21514 Middle East Respiratory Syndrome coronavirus isolate KSA-CAMEL-376 RdRp JX869059.2:279-13454 Human betacoronavirus MERS 2c EMC/2012 RdRp MT072668.1 SARS-CoV-2 coronavirus human RdRp 29 MT084071.1 Pangolin coronavirus isolate MP789 RdRp 53 KM888179.1 Hare Coronavirus (RdRp) gene partial 99 AB918718.1 Bat coronavirus IFB2012-17F RdRp gene partial LC469028.1:1-292 Bat coronavirus Mi CoV-1 RdRp gene partial - HQ728484.1:1-2424-8045 Miniopterus bat coronavirus Kenya RdRp gene partial cds NC 009224.1:2631-5147 Botryotinia fuckeliana totivirus 1 complete genome Evolutionary analysis by Maximum Likelihood method The evolutionary history was inferred by using the Maximum Likelihood method and Tamura 3-parameter model [1]. The tree with the highest log likelihood (-2012.31) is shown. The percentage of trees in which the associated taxa clustered together is shown next to the branches. Initial tree(s) for the heuristic search were obtained automatically by applying Neighbor-Join and BioNJ algorithms to a matrix of pairwise distances estimated using the Tamura 3 parameter model, and then selecting the topology with superior log likelihood value. A discrete Gamma distribution was used to model evolutionary rate differences among sites (5 categories (+G, parameter = 1.4484)). This analysis involved 12 nucleotide sequences. All positions containing gaps and missing data were eliminated (complete deletion option). There were a total of 249 positions in the final dataset. Evolutionary analyses were conducted in MEGA11 [2][3] 1. Tamura K. (1992). Estimation of the number of nucleotide substitutions when there are strong transition-transversion and G + C-content biases. Molecular Biology and Evolution 9:678-687. Tamura K Stecher G and Kumar S. (2021) MEGA 11. Molecular Evolutionary Genetics Analveis Version 11 Molecular Biology and Evolution https://doi.org/10.1093/molhov/msah 120 Ready
Step by Step Solution
There are 3 Steps involved in it
Step: 1

Get Instant Access to Expert-Tailored Solutions
See step-by-step solutions with expert insights and AI powered tools for academic success
Step: 2

Step: 3

Ace Your Homework with AI
Get the answers you need in no time with our AI-driven, step-by-step assistance
Get Started


