Question: 1. How much business risk does Tonka face? 2. How much potential value, if any, can Tonka create for its shareholders at each of the
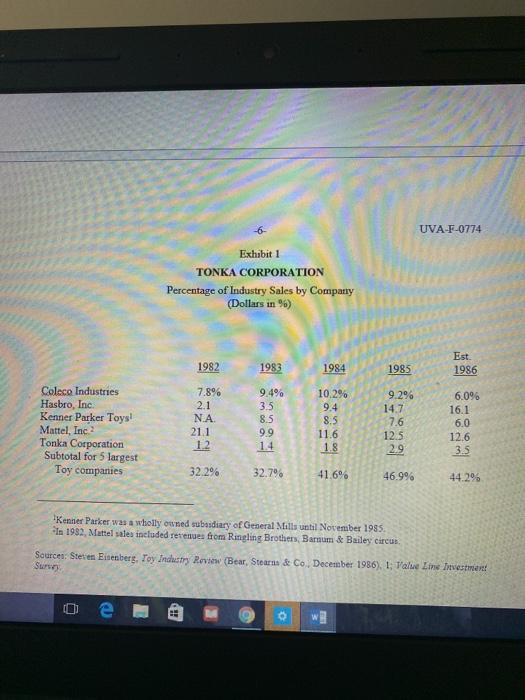
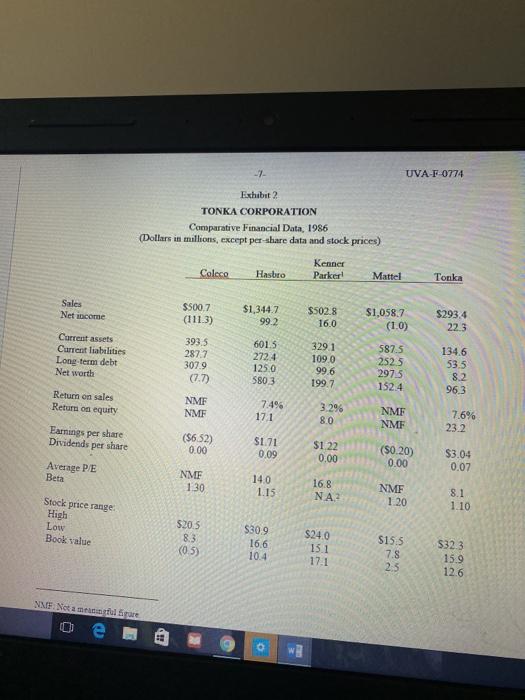
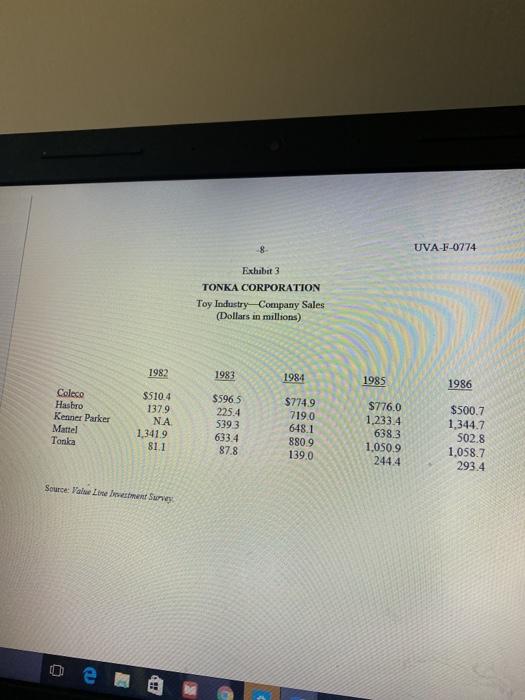
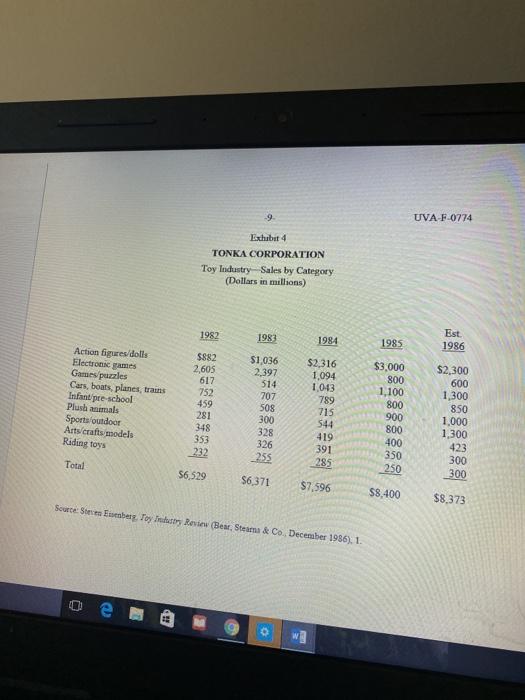
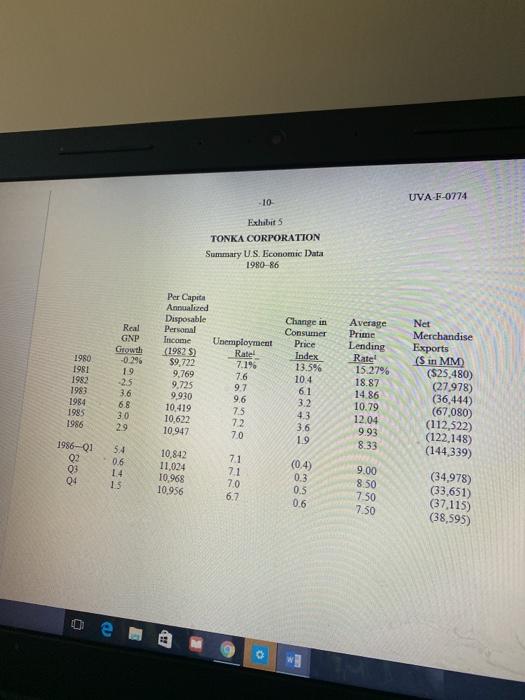
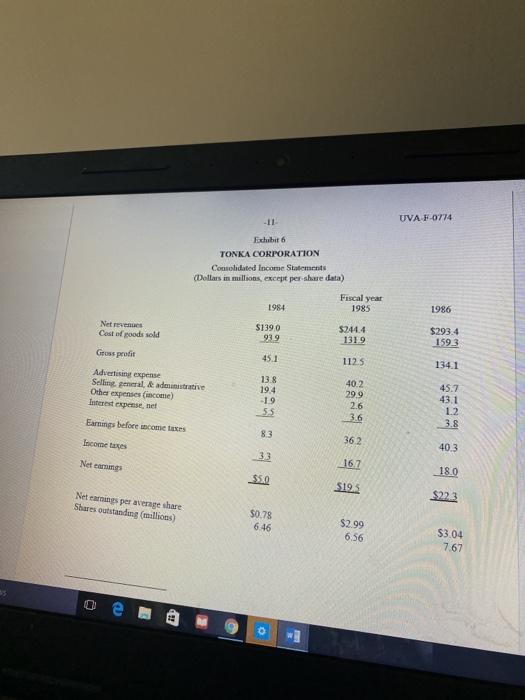
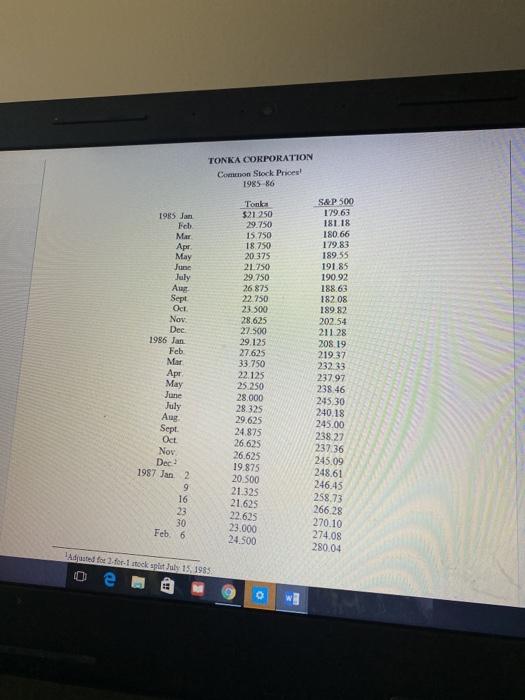
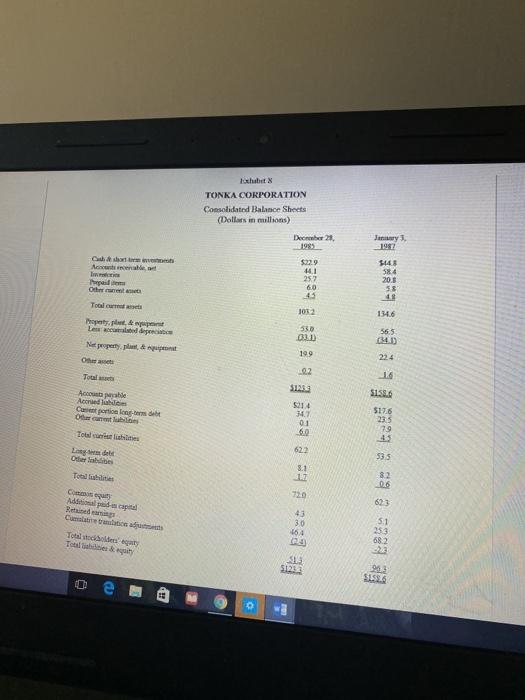
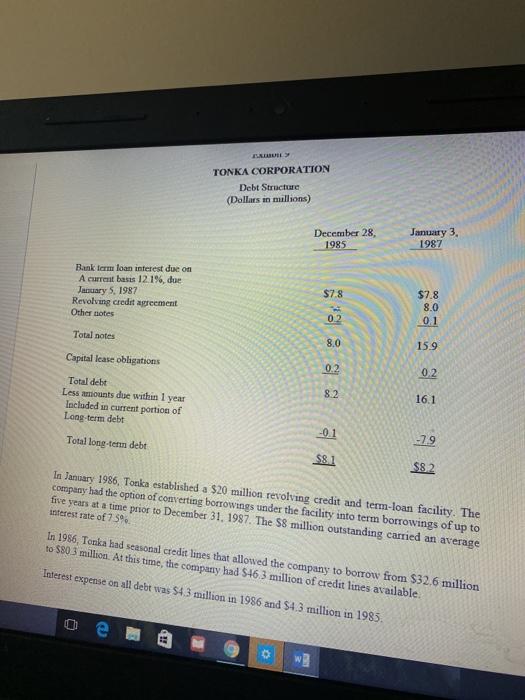
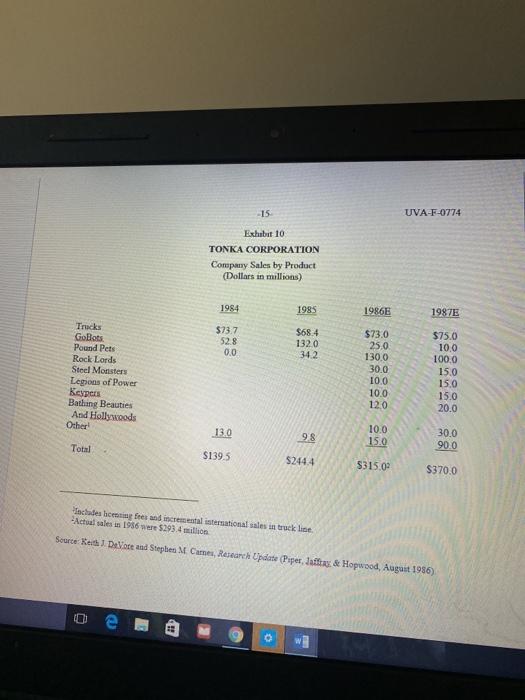
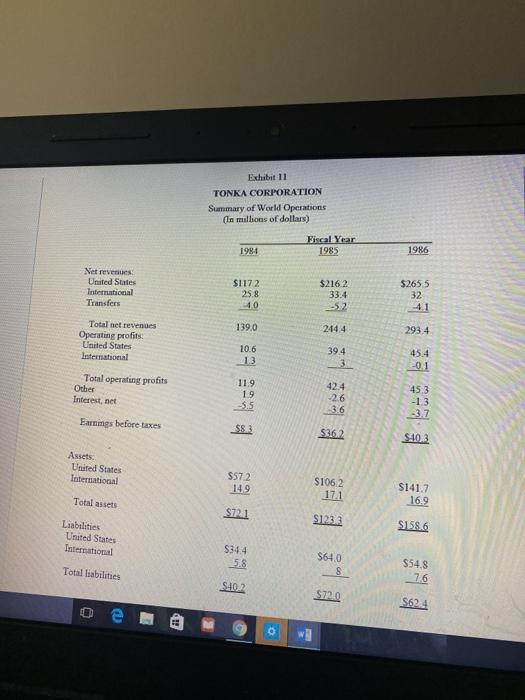
1.How much business risk does Tonka face?
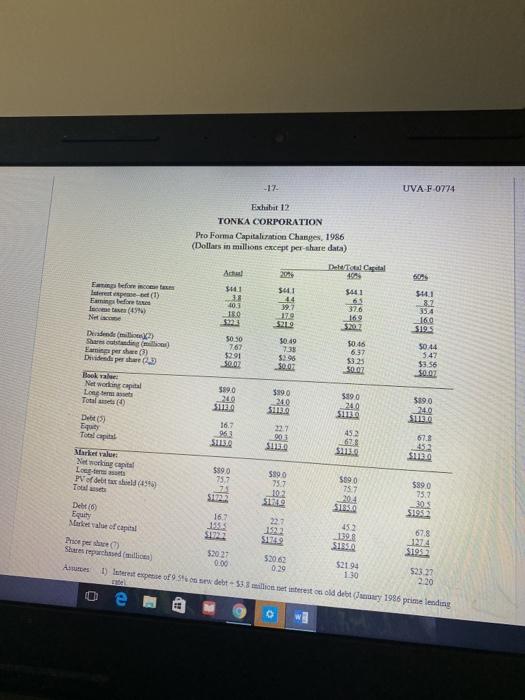
2.How much potential value, if any, can Tonka create for its shareholders at each of the proposed levels of debt? How would leveraging up affect the companys taxes?
3.How much financial risk would Tonka face at each of the proposed levels of debt shown in case Exhibit 12? How would the capital markets react to a decision by the company to increase the use of debt in its capital structure?
4.What capital structure would you recommend as appropriate for Tonka?
5.How might Tonka implement an aggressive capital-structure policy? What are the alternative tactics for leveraging up?
6.What arguments would you advance to persuade Tonkas management to adopt your recommendation?
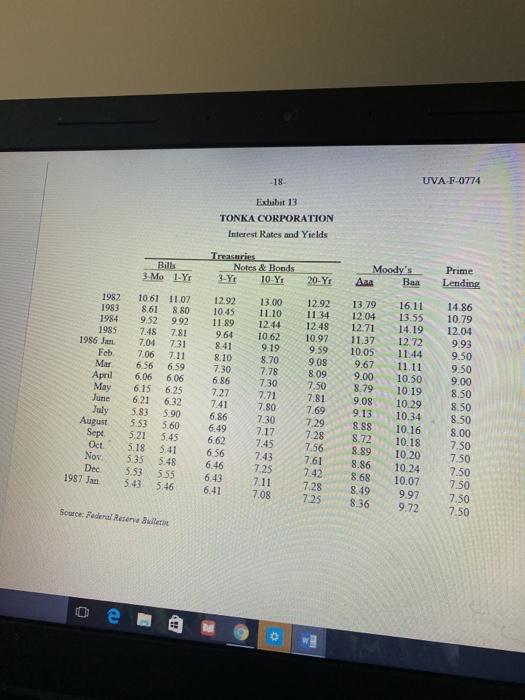
-6 UVA-F-0774 Exhibit 1 TONKA CORPORATION Percentage of Industry Sales by Comparty (Dollars in %) Est 1982 1983 1984 1985 1986 Coleco Industries Hasbro Inc Kenner Parker Toys! Mattel, Inc Tonka Corporation Subtotal for 5 largest Toy companies 7.8% 2.1 NA 21.1 1.2 9.49 3.5 8.5 99 1.4 10,2% 9.4 8.5 11.6 1.8 9.2% 14.7 7.6 12.5 2.9 6.096 16.1 6.0 12.6 3.5 32.2% 32.79 41.6% 46.9% 44.29 Kenner Parker was a wholly owned subasdiary of General Mills until November 1985. In 1982, Mattel sales included revenues from Ringling Brothers Barnum & Bailey circus Source: Steven Einenberg. Toy Industry Review (Bear, Stearns & Co. December 1986). 1: Value Line Investment Sury 0 -7 UVA-F-0774 Exhibit2 TONKA CORPORATION Comparative Financial Data, 1986 (Dollars in millions, except per share data and stock prices) Coleco Kenner Parker Hasbro Mattel Tonka Sales Net income $500.7 (1113) $1,344.7 992 $502.8 16.0 $1.058.7 (10) $293.4 223 3935 Current assets Current liabilities Long-term debt Net worth 287.7 134.6 307.9 (7.7) 601.5 2724 125.0 5803 3291 109.0 99.6 199.7 5875 2525 2975 152.4 53.5 8.2 96.3 Return on sales Return on equity NMF NMF 7.4% 171 3.296 8.0 NME NME 7.6% 23.2 Earnings per share Dividends per share (5652) 0.00 $1.71 0.09 $1 22 0.00 (50.20) 0.00 Average P/E Beta $3.04 0.07 NMF 130 14.0 1.15 168 NMF NA 1.20 8.1 1.10 Stock price range High Low Book value $20.5 83 (05) $30.9 16.6 10.4 $24.0 15.1 17.1 $15.5 7.8 25 5323 15.9 12.6 NONE Not a minifu bure e CHE w UVA-F-0774 Exhibit 3 TONKA CORPORATION Toy Industry Company Sales (Dollars in millions) 1982 1983 1984 1985 1986 Coleco Hasbro Kenner Parker Mattel Tonka $510.4 1379 NA 1,341.9 81.1 $5965 225.4 5393 633.4 87.8 $774.9 7190 648.1 880 9 139.0 $776.0 1,233.4 638.3 1,050.9 244,4 $500.7 1,344.7 502.8 1,058.7 293.4 Source: Value Linebestment Survey -9 UVA-F-0774 Exhubut 4 TONKA CORPORATION Toy Industry Sales by Category (Dollars in millions) 1982 1983 1984 1985 Est. 1986 Action figures dolls Electronic games Gases par les Cars, boats, planes, trains Infant preschool Plush animals Sports outdoor Arts/crafts models Riding toys $882 2,605 617 752 459 281 348 353 $1,036 2,397 514 707 508 300 328 326 _255 $2,316 1,094 1,043 789 715 544 419 391 285 $3,000 800 1,100 800 900 800 400 350 250 $2,300 600 1,300 850 1,000 1.300 423 300 300 232 Total S6 529 $6,371 $7,596 $8,400 $8,373 Source: Stein Sumber Toyoty Ree Bear, Steam & Co. December 1986). 1. UVA-F-0774 -10 Exhibits TONKA CORPORATION Summary U.S. Economic Data 1980-86 Real GNP Growth -0.296 19 1980 1981 1982 1983 Per Capita Annualized Disposable Personal Income (1982) $9.722 9,769 9,725 9.930 10.419 10,622 10.947 25 Unemployment Rate! 7.19 7.6 9.7 9.6 75 72 70 Change in Consumer Price Index 13.5% 104 6.1 3.2 4.3 3.6 19 Average Prime Lending Rate! 15.27% 18.87 14 86 10.79 12.04 993 8.33 Net Merchandise Exports (S in MM) ($25.480) (27,978) (36,444) (67.080) (112,522) (122,148) (144,339) 1984 1985 1986 3.6 68 3.0 29 1986-01 88 54 0.6 14 15 10,842 11,024 10.968 10.956 04 7.1 71 7.0 6.7 (0.4) 0.3 0.5 0.6 9.00 8.50 7.50 7.50 (34.978) (33.651) (37,115) (38,595) G 4 UVAF-6774 Echibit 6 TONKA CORPORATION Comohdated Income Statements (Dollars in millions, except per share data) Fiscal year 1984 1985 1986 Net revenues Cost of poods sold S1390 939 $244.4 1319 $293.4 1593 Gross profit 45.1 1125 134.1 Advertising expense Selling gal& ative Other expenses income) Instepense net 13.8 19.4 -19 55 40.2 299 2.6 36 45.7 43.1 1.2 3.8 Earnings before come totes 83 Income taxes 362 40.3 33 Netrar 167 180 $50 $195 Net canines per average share Share outstanding (millions) $22.3 $0.78 6.46 $2.99 6.56 $3.04 7.67 e TONKA CORPORATION Common Stock Prices! 1985-86 1985 Jan Feb Mar Apr May June July Aur Sept OCH Nov . Dec 1986 Jan Feb Mar Apr May June July Aug Sept Oct Nov Dec 1987 Jan 2 9 16 23 30 Feb. 6 Tonk $21250 29.750 15.750 18 750 20.375 21.750 29.750 26 875 22.750 23.500 28.625 27.500 29.125 27.625 33.750 22.125 25.250 28.000 28.325 29.625 24.875 26.625 26,625 19.875 20.500 21.325 21.625 22.625 23.000 24.500 SA P 500 129.63 18118 180.66 179.83 189.55 191.85 190.92 188.63 18208 189.82 202.54 211 28 208.19 219 37 232 33 23797 238.46 245.30 240.18 245.00 238.27 237.36 245.09 248.61 246.45 258.73 266.28 270.10 274.08 280.04 Adjuted for 2.for. Istock apist July 15, 1985 e TONKA CORPORATION Consolidated Balance Sheets (Dollars in millions) January 1987 Chat New December 21 1985 $22.9 41 252 60 45 1032 $143 584 20.5 Othere Tool 41 1946 rapety.pl Les depreca 53.0 565 134) 199 Oh 224 02 Total Accide Accra Camping 5156 5176 5214 347 001 60 235 79 45 622 535 8.1 82 720 623 Apodacap Reisedam Creation 43 30 15. Total descar Totale 51 353 682 5121 0 FUTURE TONKA CORPORATION Debt Structure (Dollars in mullions) December 28, 1985 January 3, 1987 Bank farm loan interest due on A current basis 12.1%, due January 5, 1987 Revolving credit agreement Other notes $78 $7.8 8.0 01 02 Total notes 8.0 159 Capital lease obligations 0.2 0.2 Total debt Less mounts dae within 1 year Included in current portion of Long term debt 8.2 16.1 -0.1 Total long-term debt -79 $81 $82 In January 1986, Tonka established a $20 million revolving credit and term-loan facility. The company had the option of converting borrowings under the facility into term borrowings of up to five years at a time prior to December 31, 1987. The 58 million outstanding carried an average interest rate of 75% In 1986, Tonka kad seasonal credit lines that allowed the company to borrow from $32.6 million to $80 3 million. At this time, the company had $46,3 million of credit lies available. Interest expense on all debt was 54.3 million in 1986 and $4.3 million in 1985. 0 W? 15 UVA-F-0774 Exhibit 10 TONKA CORPORATION Company Sales by Product (Dollars in millions) 1984 1985 1986E 1987E $73.7 52.8 0.0 $68.4 1320 34.2 Trucks Gobots Pound Pets Rock Lords Steel Monsters Legions of Power Beypers Bathing Beauties And Hollywoods Other $73.0 25.0 1300 30.0 10.0 10.0 12.0 $75.0 100 100,0 15.0 150 15.0 20.0 13.0 98 10.0 15.0 30.0 Total 90.0 $139.5 $244.4 5315.02 $370.0 includes being fees and incremental international sales in truck line Achale 19365293.4 million Scorte Keith DeVore and Stephen M Cames Research Update Pipera & Hopwood, August 1986) e 0 Exhibit 11 TONKA CORPORATION Summary of World Operations (In millions of dollars) 1984 Fiscal Year 1985 1986 Net revenues United States International Transfers $1172 25.8 10 $216.2 33.4 $2655 32 139.0 2444 293.4 Total net revenues Operating profits United States International 10.6 13 394 3. 45.4 -0.1 Total operating profits Other Interest, net 42.4 11.9 19 5.5 -26 453 -13 -3.7 -3.6 Earnings before taxes $83 $3.62 $10.3 Assets United States International $572 149 S1062 171 $141.7 16.9 Total assets $72.1 $1232 SI56 Liabilities United States International $344 58 $64.0 8 Total liabilities $54.8 76 SIO2 $120 5624 e -17- UVA F0774 Exhibit 12 TONKA CORPORATION Pro Forma Capitalization Changes, 1986 (Dollars in millions except pershare data) 20 Dettol Cigal 403 $41 En efence pe (1) Emin before Net 40.3 180 5411 44 39.7 179 5219 $441 65 376 169 5441 82 354 100 $195 Dvd () Emi persha) Dividende per 3 50.30 7,67 $291 $0.02 $0.49 738 $395 30.07 50.46 6.37 5323 $0:44 5.47 $9.56 10.02 Book Netwopital Long Total 3890 $19.0 240 $59.0 240 S1130 $19.0 249 SU2O Det (3) Equity Tilapital 16.7 963 S113 452 $1130 67.8 452 SO $180 Networking capital $190 5890 5090 75.7 75.7 $890 75.7 pobet (459) 752 Tout 102 204 SHA SRL 510 Debt 16.7 Egy 452 135 12 67.8 Market value of capital 1727 SIA $1952 Price dalia) 52027 52062 ) $21.94 0.00 52322 1.30 220 D) rest expense of 9 S c se debt - 33.3 millimeto old debt 1986 prime lending 0.29 o 2 18 UVA-F-0774 Exlubit 13 TONKA CORPORATION Interest Rates and Yields Bills 3. Mo LLYT Treasures Notes & Boods 3-Y 10 Y: 20-YI Moody's Aaa Baa Prime Lending 13.00 11.10 12.44 1062 1982 1983 1984 1985 1986 Jan Feb Mar April May June 10.61 11.07 861 8.80 9.52 9.92 7.48 7.81 7.04 731 7.06 7.11 6.56 6.59 6.06 606 6.15 6.21 6.32 5.83 5.90 5.53 5.60 5.21 5.45 5.18 5.41 5:35 5.48 5.53 5.55 3.43 5.46 6.25 12.92 10.45 11 89 9.64 8.41 8.10 7.30 6.86 7.22 7.41 6.86 6.49 6,62 6.56 6.46 6.43 6.41 12.92 11 34 12.48 10.97 9.59 9.08 8.09 7.50 7.81 7.69 7.29 7.28 7.56 7.61 7.42 7.28 725 9.19 8.70 7.78 7.30 7.71 7.80 7.30 7.17 7.45 7.43 July August Sept Oct 13 79 12.04 12.71 11.37 10.05 9.67 9.00 8.79 9.08 9.13 8.88 8.72 8.89 8.86 8.68 8.49 8.36 16.11 13.55 14.19 12.72 11.44 11.11 10.50 10.19 10.29 10.34 10.16 10.18 10.20 10.24 10.07 9.97 9.72 14.86 10.79 12.04 9.93 9.50 9.50 9.00 8.50 8.50 8.50 8.00 7.50 7.50 7.50 7.50 7.50 7.50 Nov Dec 1987 Jan 7.25 7.11 7.08 Scarpe Federal Reserwe were 0 e -6 UVA-F-0774 Exhibit 1 TONKA CORPORATION Percentage of Industry Sales by Comparty (Dollars in %) Est 1982 1983 1984 1985 1986 Coleco Industries Hasbro Inc Kenner Parker Toys! Mattel, Inc Tonka Corporation Subtotal for 5 largest Toy companies 7.8% 2.1 NA 21.1 1.2 9.49 3.5 8.5 99 1.4 10,2% 9.4 8.5 11.6 1.8 9.2% 14.7 7.6 12.5 2.9 6.096 16.1 6.0 12.6 3.5 32.2% 32.79 41.6% 46.9% 44.29 Kenner Parker was a wholly owned subasdiary of General Mills until November 1985. In 1982, Mattel sales included revenues from Ringling Brothers Barnum & Bailey circus Source: Steven Einenberg. Toy Industry Review (Bear, Stearns & Co. December 1986). 1: Value Line Investment Sury 0 -7 UVA-F-0774 Exhibit2 TONKA CORPORATION Comparative Financial Data, 1986 (Dollars in millions, except per share data and stock prices) Coleco Kenner Parker Hasbro Mattel Tonka Sales Net income $500.7 (1113) $1,344.7 992 $502.8 16.0 $1.058.7 (10) $293.4 223 3935 Current assets Current liabilities Long-term debt Net worth 287.7 134.6 307.9 (7.7) 601.5 2724 125.0 5803 3291 109.0 99.6 199.7 5875 2525 2975 152.4 53.5 8.2 96.3 Return on sales Return on equity NMF NMF 7.4% 171 3.296 8.0 NME NME 7.6% 23.2 Earnings per share Dividends per share (5652) 0.00 $1.71 0.09 $1 22 0.00 (50.20) 0.00 Average P/E Beta $3.04 0.07 NMF 130 14.0 1.15 168 NMF NA 1.20 8.1 1.10 Stock price range High Low Book value $20.5 83 (05) $30.9 16.6 10.4 $24.0 15.1 17.1 $15.5 7.8 25 5323 15.9 12.6 NONE Not a minifu bure e CHE w UVA-F-0774 Exhibit 3 TONKA CORPORATION Toy Industry Company Sales (Dollars in millions) 1982 1983 1984 1985 1986 Coleco Hasbro Kenner Parker Mattel Tonka $510.4 1379 NA 1,341.9 81.1 $5965 225.4 5393 633.4 87.8 $774.9 7190 648.1 880 9 139.0 $776.0 1,233.4 638.3 1,050.9 244,4 $500.7 1,344.7 502.8 1,058.7 293.4 Source: Value Linebestment Survey -9 UVA-F-0774 Exhubut 4 TONKA CORPORATION Toy Industry Sales by Category (Dollars in millions) 1982 1983 1984 1985 Est. 1986 Action figures dolls Electronic games Gases par les Cars, boats, planes, trains Infant preschool Plush animals Sports outdoor Arts/crafts models Riding toys $882 2,605 617 752 459 281 348 353 $1,036 2,397 514 707 508 300 328 326 _255 $2,316 1,094 1,043 789 715 544 419 391 285 $3,000 800 1,100 800 900 800 400 350 250 $2,300 600 1,300 850 1,000 1.300 423 300 300 232 Total S6 529 $6,371 $7,596 $8,400 $8,373 Source: Stein Sumber Toyoty Ree Bear, Steam & Co. December 1986). 1. UVA-F-0774 -10 Exhibits TONKA CORPORATION Summary U.S. Economic Data 1980-86 Real GNP Growth -0.296 19 1980 1981 1982 1983 Per Capita Annualized Disposable Personal Income (1982) $9.722 9,769 9,725 9.930 10.419 10,622 10.947 25 Unemployment Rate! 7.19 7.6 9.7 9.6 75 72 70 Change in Consumer Price Index 13.5% 104 6.1 3.2 4.3 3.6 19 Average Prime Lending Rate! 15.27% 18.87 14 86 10.79 12.04 993 8.33 Net Merchandise Exports (S in MM) ($25.480) (27,978) (36,444) (67.080) (112,522) (122,148) (144,339) 1984 1985 1986 3.6 68 3.0 29 1986-01 88 54 0.6 14 15 10,842 11,024 10.968 10.956 04 7.1 71 7.0 6.7 (0.4) 0.3 0.5 0.6 9.00 8.50 7.50 7.50 (34.978) (33.651) (37,115) (38,595) G 4 UVAF-6774 Echibit 6 TONKA CORPORATION Comohdated Income Statements (Dollars in millions, except per share data) Fiscal year 1984 1985 1986 Net revenues Cost of poods sold S1390 939 $244.4 1319 $293.4 1593 Gross profit 45.1 1125 134.1 Advertising expense Selling gal& ative Other expenses income) Instepense net 13.8 19.4 -19 55 40.2 299 2.6 36 45.7 43.1 1.2 3.8 Earnings before come totes 83 Income taxes 362 40.3 33 Netrar 167 180 $50 $195 Net canines per average share Share outstanding (millions) $22.3 $0.78 6.46 $2.99 6.56 $3.04 7.67 e TONKA CORPORATION Common Stock Prices! 1985-86 1985 Jan Feb Mar Apr May June July Aur Sept OCH Nov . Dec 1986 Jan Feb Mar Apr May June July Aug Sept Oct Nov Dec 1987 Jan 2 9 16 23 30 Feb. 6 Tonk $21250 29.750 15.750 18 750 20.375 21.750 29.750 26 875 22.750 23.500 28.625 27.500 29.125 27.625 33.750 22.125 25.250 28.000 28.325 29.625 24.875 26.625 26,625 19.875 20.500 21.325 21.625 22.625 23.000 24.500 SA P 500 129.63 18118 180.66 179.83 189.55 191.85 190.92 188.63 18208 189.82 202.54 211 28 208.19 219 37 232 33 23797 238.46 245.30 240.18 245.00 238.27 237.36 245.09 248.61 246.45 258.73 266.28 270.10 274.08 280.04 Adjuted for 2.for. Istock apist July 15, 1985 e TONKA CORPORATION Consolidated Balance Sheets (Dollars in millions) January 1987 Chat New December 21 1985 $22.9 41 252 60 45 1032 $143 584 20.5 Othere Tool 41 1946 rapety.pl Les depreca 53.0 565 134) 199 Oh 224 02 Total Accide Accra Camping 5156 5176 5214 347 001 60 235 79 45 622 535 8.1 82 720 623 Apodacap Reisedam Creation 43 30 15. Total descar Totale 51 353 682 5121 0 FUTURE TONKA CORPORATION Debt Structure (Dollars in mullions) December 28, 1985 January 3, 1987 Bank farm loan interest due on A current basis 12.1%, due January 5, 1987 Revolving credit agreement Other notes $78 $7.8 8.0 01 02 Total notes 8.0 159 Capital lease obligations 0.2 0.2 Total debt Less mounts dae within 1 year Included in current portion of Long term debt 8.2 16.1 -0.1 Total long-term debt -79 $81 $82 In January 1986, Tonka established a $20 million revolving credit and term-loan facility. The company had the option of converting borrowings under the facility into term borrowings of up to five years at a time prior to December 31, 1987. The 58 million outstanding carried an average interest rate of 75% In 1986, Tonka kad seasonal credit lines that allowed the company to borrow from $32.6 million to $80 3 million. At this time, the company had $46,3 million of credit lies available. Interest expense on all debt was 54.3 million in 1986 and $4.3 million in 1985. 0 W? 15 UVA-F-0774 Exhibit 10 TONKA CORPORATION Company Sales by Product (Dollars in millions) 1984 1985 1986E 1987E $73.7 52.8 0.0 $68.4 1320 34.2 Trucks Gobots Pound Pets Rock Lords Steel Monsters Legions of Power Beypers Bathing Beauties And Hollywoods Other $73.0 25.0 1300 30.0 10.0 10.0 12.0 $75.0 100 100,0 15.0 150 15.0 20.0 13.0 98 10.0 15.0 30.0 Total 90.0 $139.5 $244.4 5315.02 $370.0 includes being fees and incremental international sales in truck line Achale 19365293.4 million Scorte Keith DeVore and Stephen M Cames Research Update Pipera & Hopwood, August 1986) e 0 Exhibit 11 TONKA CORPORATION Summary of World Operations (In millions of dollars) 1984 Fiscal Year 1985 1986 Net revenues United States International Transfers $1172 25.8 10 $216.2 33.4 $2655 32 139.0 2444 293.4 Total net revenues Operating profits United States International 10.6 13 394 3. 45.4 -0.1 Total operating profits Other Interest, net 42.4 11.9 19 5.5 -26 453 -13 -3.7 -3.6 Earnings before taxes $83 $3.62 $10.3 Assets United States International $572 149 S1062 171 $141.7 16.9 Total assets $72.1 $1232 SI56 Liabilities United States International $344 58 $64.0 8 Total liabilities $54.8 76 SIO2 $120 5624 e -17- UVA F0774 Exhibit 12 TONKA CORPORATION Pro Forma Capitalization Changes, 1986 (Dollars in millions except pershare data) 20 Dettol Cigal 403 $41 En efence pe (1) Emin before Net 40.3 180 5411 44 39.7 179 5219 $441 65 376 169 5441 82 354 100 $195 Dvd () Emi persha) Dividende per 3 50.30 7,67 $291 $0.02 $0.49 738 $395 30.07 50.46 6.37 5323 $0:44 5.47 $9.56 10.02 Book Netwopital Long Total 3890 $19.0 240 $59.0 240 S1130 $19.0 249 SU2O Det (3) Equity Tilapital 16.7 963 S113 452 $1130 67.8 452 SO $180 Networking capital $190 5890 5090 75.7 75.7 $890 75.7 pobet (459) 752 Tout 102 204 SHA SRL 510 Debt 16.7 Egy 452 135 12 67.8 Market value of capital 1727 SIA $1952 Price dalia) 52027 52062 ) $21.94 0.00 52322 1.30 220 D) rest expense of 9 S c se debt - 33.3 millimeto old debt 1986 prime lending 0.29 o 2 18 UVA-F-0774 Exlubit 13 TONKA CORPORATION Interest Rates and Yields Bills 3. Mo LLYT Treasures Notes & Boods 3-Y 10 Y: 20-YI Moody's Aaa Baa Prime Lending 13.00 11.10 12.44 1062 1982 1983 1984 1985 1986 Jan Feb Mar April May June 10.61 11.07 861 8.80 9.52 9.92 7.48 7.81 7.04 731 7.06 7.11 6.56 6.59 6.06 606 6.15 6.21 6.32 5.83 5.90 5.53 5.60 5.21 5.45 5.18 5.41 5:35 5.48 5.53 5.55 3.43 5.46 6.25 12.92 10.45 11 89 9.64 8.41 8.10 7.30 6.86 7.22 7.41 6.86 6.49 6,62 6.56 6.46 6.43 6.41 12.92 11 34 12.48 10.97 9.59 9.08 8.09 7.50 7.81 7.69 7.29 7.28 7.56 7.61 7.42 7.28 725 9.19 8.70 7.78 7.30 7.71 7.80 7.30 7.17 7.45 7.43 July August Sept Oct 13 79 12.04 12.71 11.37 10.05 9.67 9.00 8.79 9.08 9.13 8.88 8.72 8.89 8.86 8.68 8.49 8.36 16.11 13.55 14.19 12.72 11.44 11.11 10.50 10.19 10.29 10.34 10.16 10.18 10.20 10.24 10.07 9.97 9.72 14.86 10.79 12.04 9.93 9.50 9.50 9.00 8.50 8.50 8.50 8.00 7.50 7.50 7.50 7.50 7.50 7.50 Nov Dec 1987 Jan 7.25 7.11 7.08 Scarpe Federal Reserwe were 0 e
Step by Step Solution
There are 3 Steps involved in it

Get step-by-step solutions from verified subject matter experts


